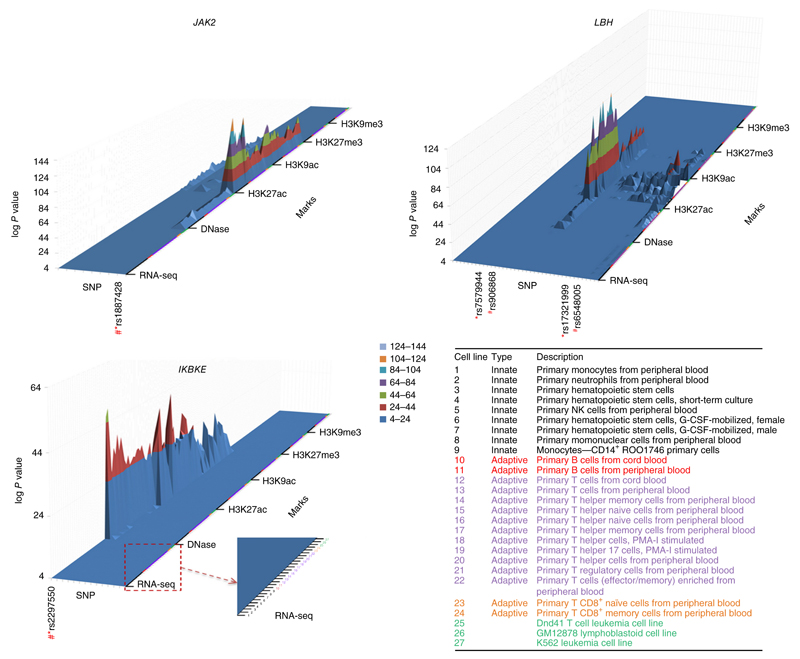
Figure 3.
3D enrichment plots depicting epigenetic modifications of ±50 bp overlapping all SNPs in the credibility sets for the 11 newly identified associated SNPs. The SNPs are shown as individual tracks on the x-axis with the SNP used in the replication study (*) and the SNP that showed the best evidence for colocalization with the most prominent epigenetic mark (#). Other SNP identities are listed in supplementary Table 6. The z-axis represents the log10 P value against the null hypothesis that peak intensity arises from the control distribution. The z-axis is truncated at a lower level (P < 10−4). For each novel associated locus, results are shown for RNA expression (RNA-seq), accessibility to DNase, histone modification by acetylation (H3K27ac, H3K9ac) and histone modification by methylation (H3K27me3, H3K9me3) over 27 immune cells. The data from the blood cell types are consistently ordered on the y-axis according to the annotation in the lower right of the figure: categories 1–9, innate-response immune cells; categories 10–24, adaptive-response immune cells (categories 10 and 11, B cells; categories 12–24, T cells); categories 25–27, cell lines.

