Figure 2.
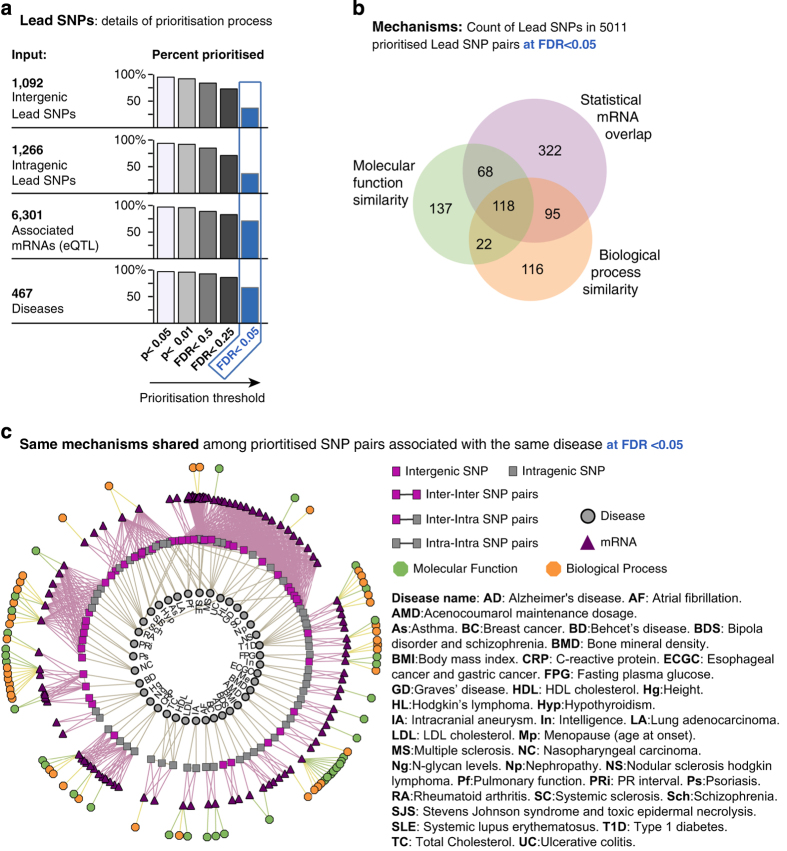
Surveyed Lead SNPs associated with mRNA expression and diseases found in prioritised Lead SNP pairs. Lead SNP pairs were prioritised by mRNAs overlap, molecular function similarity or biological process similarity (a) Input shown on the left, percentage of Lead SNPs in the prioritised SNP pairs and their associated mRNAs and diseases found among total surveyed Lead SNPs. Different P value and FDR cutoffs were applied to stratify SNP pair prioritisation and percent-derived Lead SNPs (bars). Results at FDR<0.05 (406 intergentic lead SNPs, 472 intragenic lead SNPs, 4,493 mRNA and 312 diseases; blue highlight) were selected for subsequent analyses. (b) Venn diagram of Lead SNPs in the 5,011 prioritised pairs according to mRNA overlap, molecular function similarity, and biological process similarity. (c) The network illustrates the subset of Lead SNP pairs where both SNPs had been associated with the same disease prioritised only by the overlap of mRNA, molecular function (GO–MF) or biological processes (GO–BP) at FDR<0.05, excluding GO terms found by similarity. Under this criterion, 72 (out of 105) prioritised Lead SNP pairs associated with the same disease. Five additional ones found by similarity of GO terms are not shown for visualisation clarity. 467 diseases were used as input (Materials and Methods).

