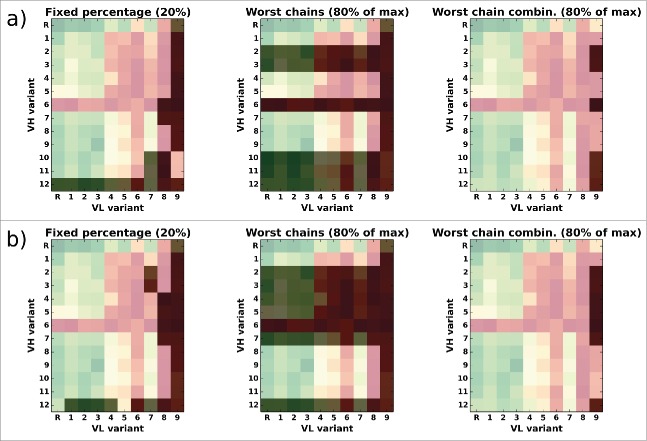
Figure 10.
Overlay of the CD81K04 binding cell ELISA matrix (green indicates high binding signals, red low binding signals) with the selection matrix for each of the 3 rejection methods (darkened cells indicate rejected VH-VL pairs). The letter R denotes the murine reference VH or VL. Panel a) shows selections based on the leave-one-out predictor, panel b) shows selections based on the all-knowing predictor.

