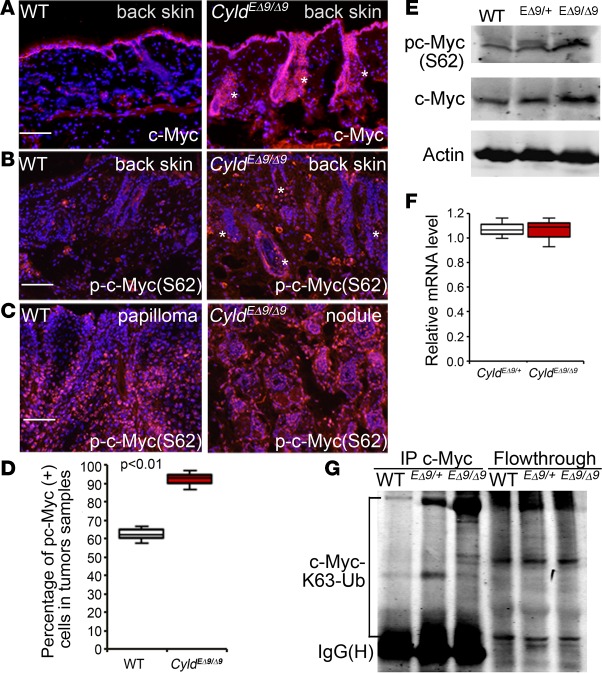
Figure 4. c-Myc displays increased activation and K63-Ub in CyldEΔ9/Δ9 mouse skin.
(A–C) Immunostaining of mouse back skin or chemically induced skin tumors. c-Myc or phospho-c–Myc(S62) (orange); Nuclei (blue). Asterisks mark c-Myc–positive hair follicles and sebaceous glands. (D) Quantification of phospho-c–Myc–positive cells. Graph shows average percentages of phospho-c–Myc (S62)–positive cells with data representing 25th–75th percentiles (box), median (line), and 5th and 95th percentiles (whiskers). Three images of each group were counted. P value was obtained via student t test. (E) Immunoblotting with mouse epidermal extracts for c-Myc, phospho-c–Myc (S62), and Actin. (F) RT-PCR for c-Myc with total RNA isolated from 3-month-old CyldEΔ9/+ and CyldEΔ9/Δ9 mice skin (n = 3 per group) and GAPDH used as an internal control. Data represent 25th–75th percentiles (box), median (line), and 5th and 95th percentiles (whiskers). (G) IP of mouse epidermal extracts with an antibody against c-Myc and then immunoblotting for K63-Ub or c-Myc. Scale bars: 100 μm.

