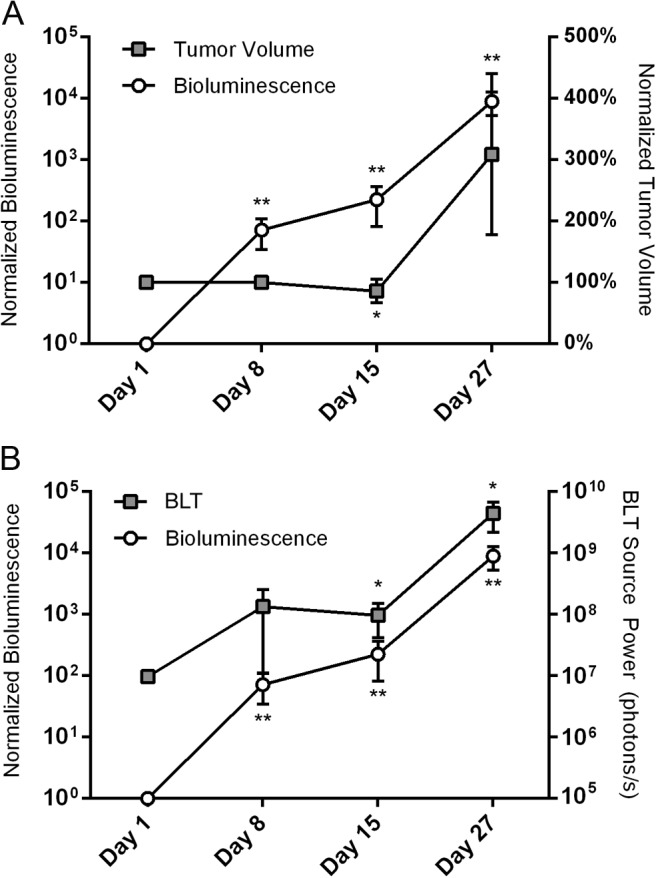
Figure 7.

Bioluminescent imaging (BLI) signal and segmented tumor volume values at different time points following transplantation, normalized to the initial values at day 1 (n = 3) (A). Comparison of the total BLI signal, normalized to the initial values at day 1, against the BLT-reconstructed source power (n = 3) (B). Results are presented as mean values ± SD; asterisks denote significance level versus day 1 (*P < .10, **P < .05).
