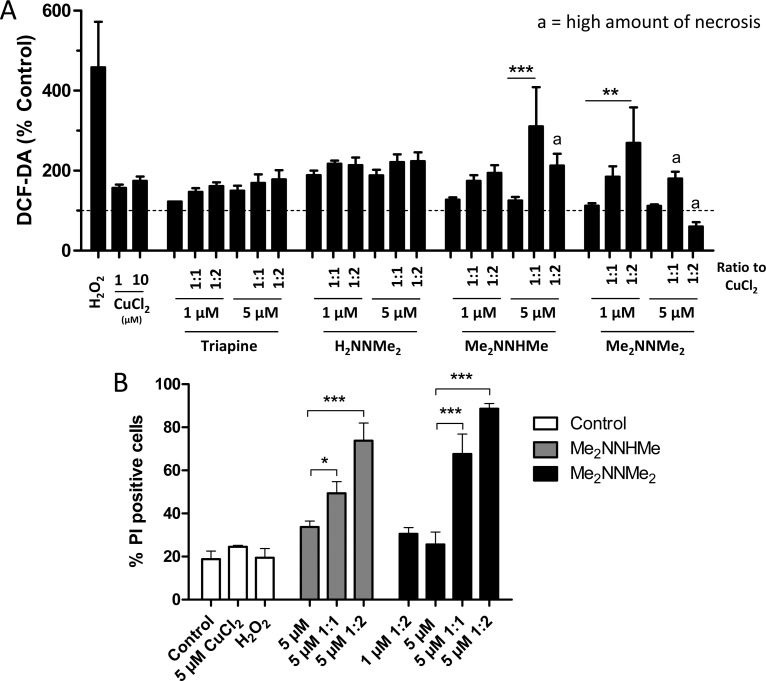
Figure 5.
(A) Intracellular ROS production in HL-60 cells after 30 min treatment of Triapine or its derivatives and 15 min prior to incubation with CuCl2. As positive control, H2O2 was used. DCF-DA fluorescence was measured using flow cytometry. (B) Percentage of dead cells in conditions according to the DCF-DA assay. Cells were stained with Hoechst/PI, and the percentage of PI-positive cells was determined microscopically. Ligand/copper(II) ion ratio, 1:1 and 1:2. The values given are the mean ± the standard deviation of three experiments. Significances were established using one-way ANOVA with Bonferroni’s multiple comparison test (***p ≤ 0.001; **p ≤ 0.01; *p ≤ 0.05).

