Fig. 1.

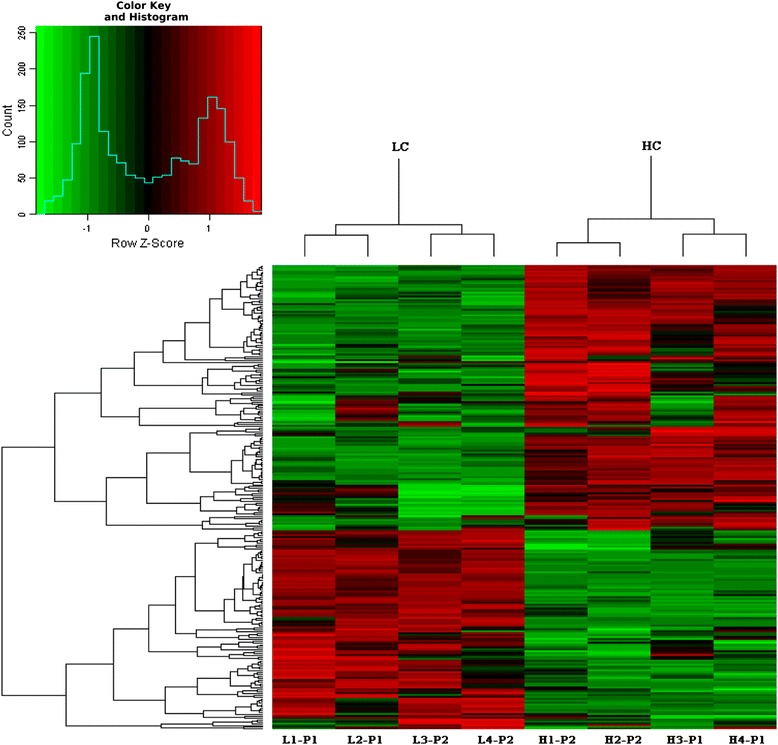
The hierarchical cluster analysis of DEGs. 246 differentially expressed (P < 0.05 and fold-change > 1.5) were included in the analysis. The red color indicated the high expression and the green color indicated low expression

The hierarchical cluster analysis of DEGs. 246 differentially expressed (P < 0.05 and fold-change > 1.5) were included in the analysis. The red color indicated the high expression and the green color indicated low expression