Fig. 3.

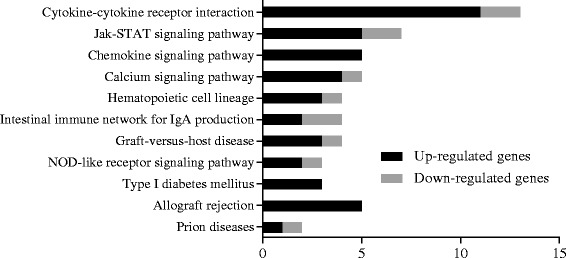
The distribution of DEGs in pathways, only enriched pathways were presented. The black bars indicated the number of up-regulated genes, while the grey bars indicated the number of down-regulated genes

The distribution of DEGs in pathways, only enriched pathways were presented. The black bars indicated the number of up-regulated genes, while the grey bars indicated the number of down-regulated genes