
Fig. 3.
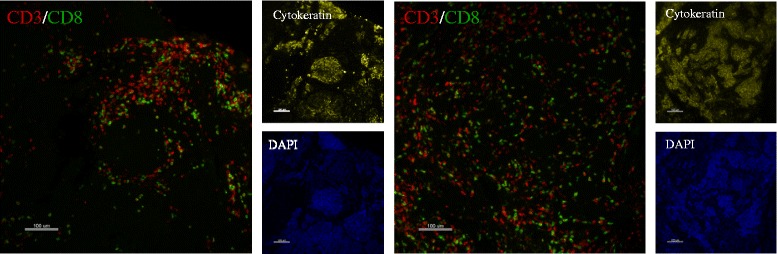
Representative immunofluorescence images of CD3 and CD8 in one patient. FOVs were compared between different core biopsies of the same patient. Spatial distribution of CD3+ and CD8+ T cells shows both random distribution of T cells among the various margins between and around epithelial cells and also aggregations of T cells into clusters near tumors