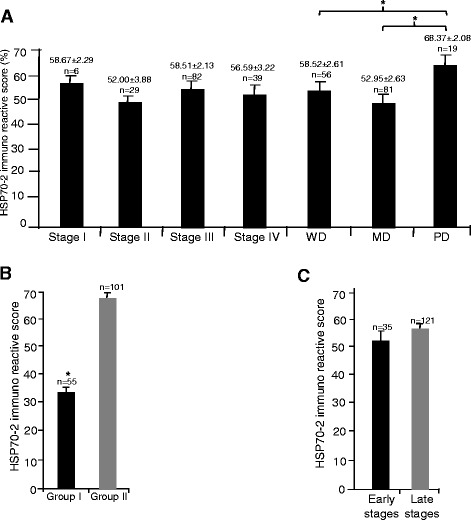
Fig. 3.

HSP70-2 Immunoreactive Score (IRS). Representative histogram depicts (a) HSP70-2 IRS of CRC specimens of stages I-IV and grades WD, MD and PD. b HSP70-2 IRS of CRC specimens based on percentage of tumor cells expressing HSP70-2 (group I, <50 % cells expressing HSP70-2; group II, >50 % cells expressing HSP70-2). c HSP70-2 IRS of early and late stage CRC specimens. WD: well differentiated, MD: moderately differentiated and PD: poorly differentiated. *p < 0.005, statistically significant
