Fig. 1.

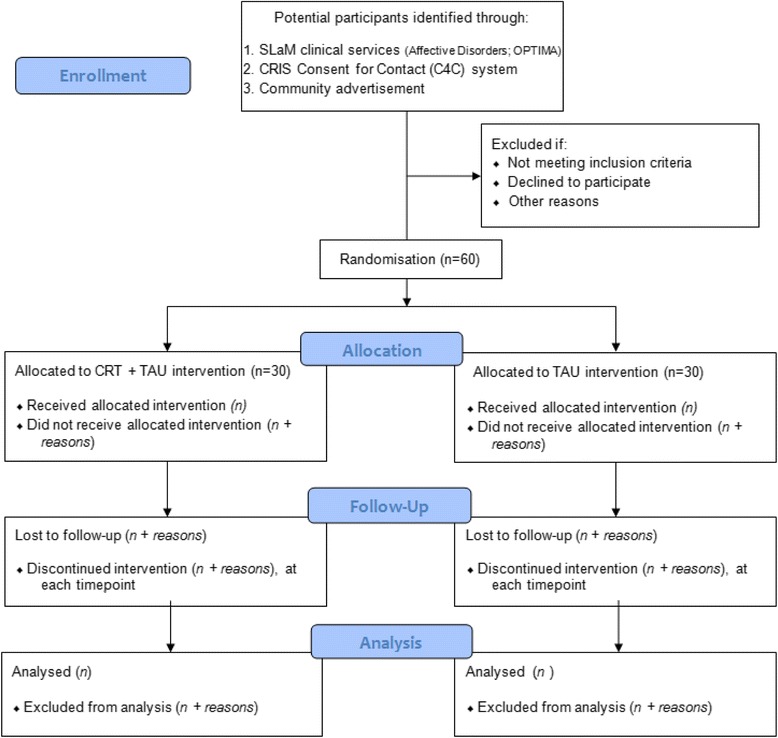
CONSORT flow diagram. The flow chart depicts participant progression through the study from initial enrolment through allocation, follow-up and finally analyses of their data stages

CONSORT flow diagram. The flow chart depicts participant progression through the study from initial enrolment through allocation, follow-up and finally analyses of their data stages