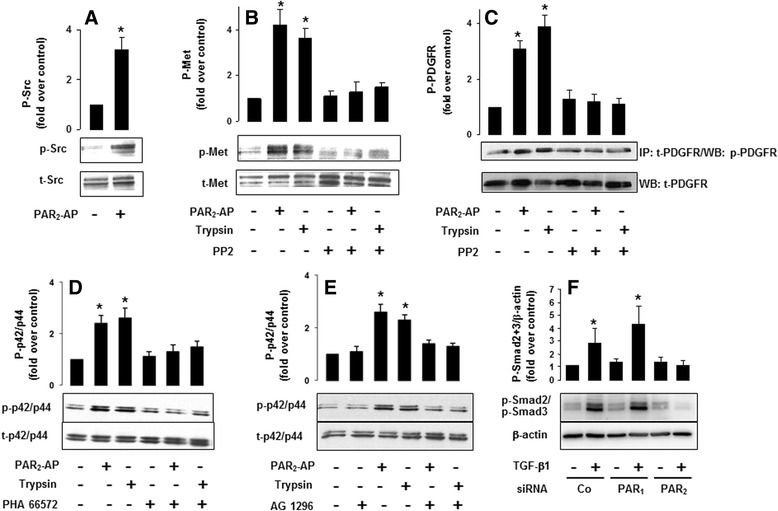
Fig. 3.

PAR2 mediates activation of Src, Met, PDGFR and p42/p44 MAPK. LX-2-wt cells were cultured serum-starved for 17 h. a The cells were treated with PAR2-AP (10 μM) for 3 min and cell lysates were subjected to SDS-PAGE and Western blotting with an anti-phospho-Src antibody and re-probed with an anti-Src antibody. P-Src = phosphorylated Src, t-Src = total Src. b The cells were treated with PAR2-AP (10 μM) or (b-e) trypsin (10 nM) for 3 min and cell lysates were subjected to SDS-PAGE and Western blotting with an anti-phospho-Met antibody and re-probed with an anti-Met antibody. P-Met = phosphorylated Met, t-Met = total Met. c The cells were treated with PAR2-AP (10 μM) or trypsin (10 nM) for 3 min and cell lysates were subjected to SDS-PAGE and Western blotting with an anti-phospho-PDGFR antibody and re-probed with an anti-PDGFR antibody. P-PDGFR = phosphorylated PDGFR, t-PDGFR = total PDGFR. Serum-starved LX-2-wt cells were preincubated with d vehicle or the Met receptor tyrosine kinase inhibitor, PHA 665752 (0.1 μM) for 1 h or e with vehicle or the PDGFR inhibitor AG 1296 (1.0 μM) for 1 h. Following stimulation for 10 min with the respective receptor agonist cell lysates were immunoblotted with an anti-phospho-p42/p44 MAPK antibody and re-probed with a p42/p44 MAPK antibody. P-p42/p44 = phosphorylated p42/p44 MAPK, t-p42/p44 = total p42/p44 MAPK. f LX-2-wt cells were depleted of PAR2 or PAR1 protein by siRNA transfection as described in Fig. 2. Forty-eight hours after the second transfection, the growth medium was removed and replaced by fresh medium supplemented or not with 10 ng/ml TGF-β1. After 30 min, cells were lysed and immunoblotted with anti-phospho-Smad2/3 antibody and subsequently with a β-actin antibody to verify equal loading. The phosphorylated forms of Smad2 and Smad3 run as closely spaced bands due to the slightly lower electrophoretic mobility of Smad2. a-f Quantification of immunoblots was performed by scanning densitometry (Image J 1.43; National Institutes of Health, Bethesda, Maryland, USA). The data shown in the histograms above the blots are expressed as the fold increase over untreated control (averages ± S.D.) from three independent experiments. *P-value < 0.05 versus non stimulated control
