Figure 2.
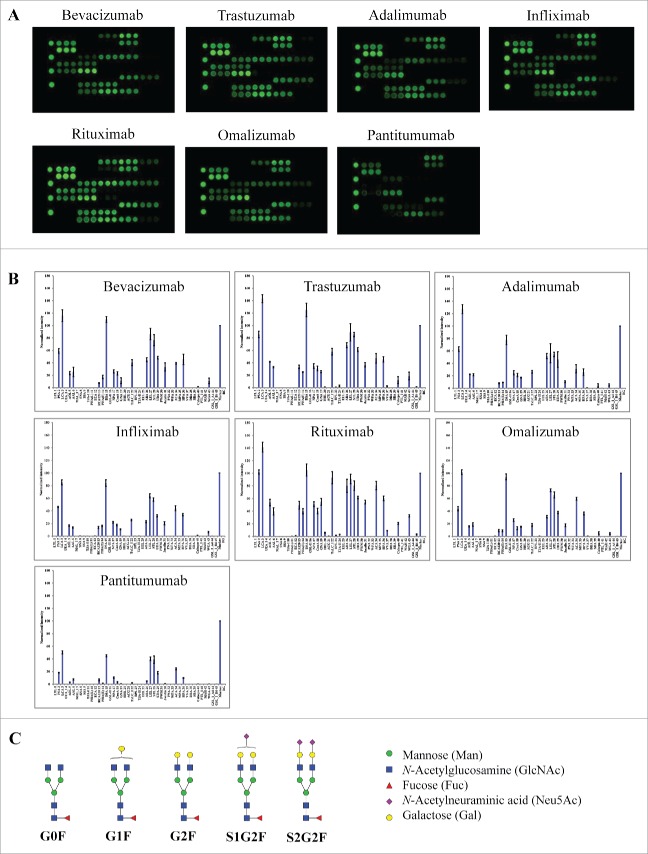
Lectin binding profiles of therapeutic IgG monoclonal antibodies. The indicated therapeutic mAbs, including bevacizumab, trastuzumab, adalimumab, infliximab, rituximab, omalizumab, and panitumumab were labeled with Cy3 and applied onto the lectin chips containing 45 distinct lectins with each being printed in triplicate. (A) Lectin binding images of the indicated samples. (B) Relative binding signals at specific lectin spots were derived from the images in A and normalized to protein markers on the same chip (mean ± SD). Shown are representatives of 3 independent experiments. The coefficient of variation (CV) was determined to be < 10% for most lectin-glycan binding signals of the samples tested. (C) Typical glycan structures present in the Fc portion of therapeutic IgG1 mAbs.27

