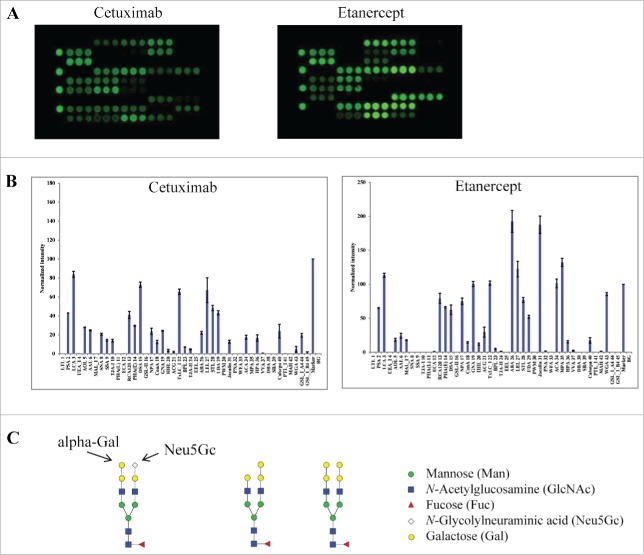
Figure 3.
Lectin binding profiles of cetuximab and etanercept. Cy3-labeled samples were applied onto the lectin chips as in Figure 2. Shown are (A) representative lectin binding images, (B) Relative binding signals at specific lectin spots (mean ± SD), and (C) Typical glycan structures present in the Fab portion of cetuximab.30

