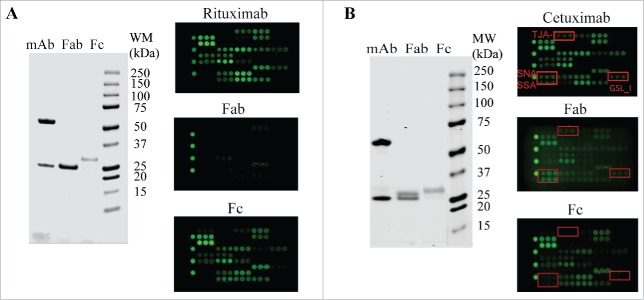
Figure 4.
Glycan profiling of Fabs and Fcs. The Fabs and Fcs of rituximab (A) and cetuximab (B) were prepared as described in Materials and Methods. Purified Fab and Fc were analyzed by reducing SDS-PAGE (left panel) and lectin microarray (right panel). As noted, the dimeric Fcs (˜ 55 kDa) were reduced to monomeric products (˜ 30 kDa) on SDS-PAGE under reducing conditions.

