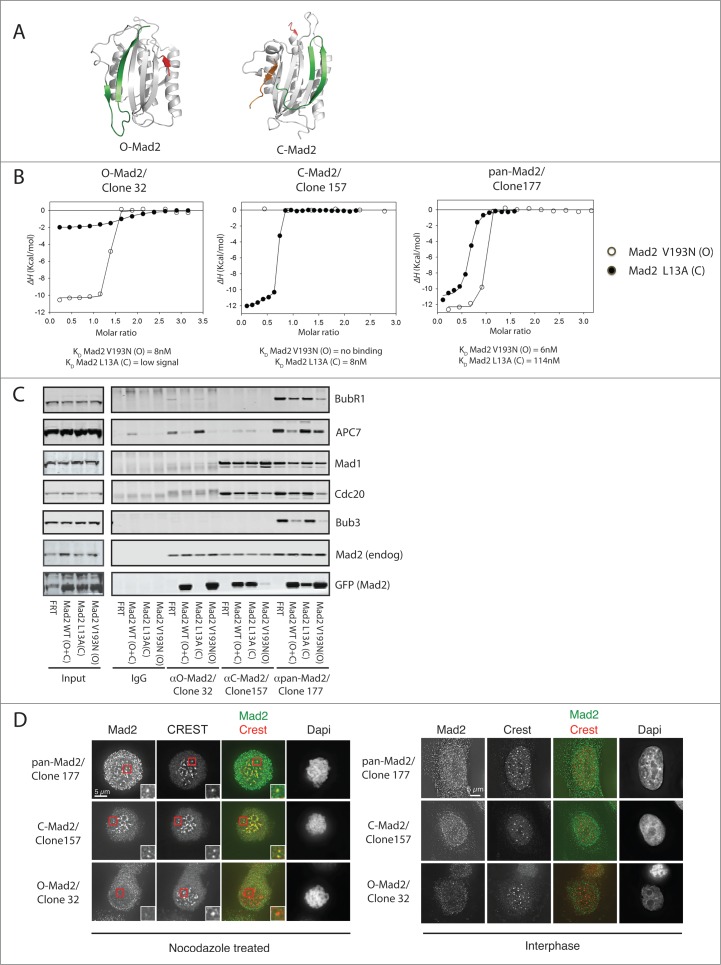
Figure 1.
Characterization of Mad2 monoclonal antibodies. (A) Structure of O-Mad2 and C-Mad2 with the C- and N-terminus colored in green and red, respectively. In the C-Mad2 structure, a ligand (orange) is bound mimicking the binding of Cdc20 and Mad1. O-Mad2 modified from PDB 1DUJ and C-Mad2 modified from PDB 1KLQ. (B) ITC measurements using purified Mad2 monoclonal antibodies and recombinant Mad2 L13A/R133A (C-Mad2) and Mad2 V193N/R133A (O-Mad2) to determine binding specificity and affinity of the antibodies. (C) Stable HeLa cell lines expressing Mad2-Venus, Mad2 L13A-Venus or Mad2 V193N-Venus or a control cell line (FRT) were treated with nocodazole and cells were harvested by mitotic shake-off. A mitotic extract was prepared from each cell line and Mad2 complexes were immunoprecipitated with the different Mad2 monoclonal antibodies. Samples were subsequently analyzed by SDS-PAGE and western blot and probed for the indicated proteins. (D) Immunofluorescence images of cells stained with the indicated Mad2 conformational specific antibodies. Cells were arrested in prometaphase using nocodazole or left untreated to obtain interphase cells.

