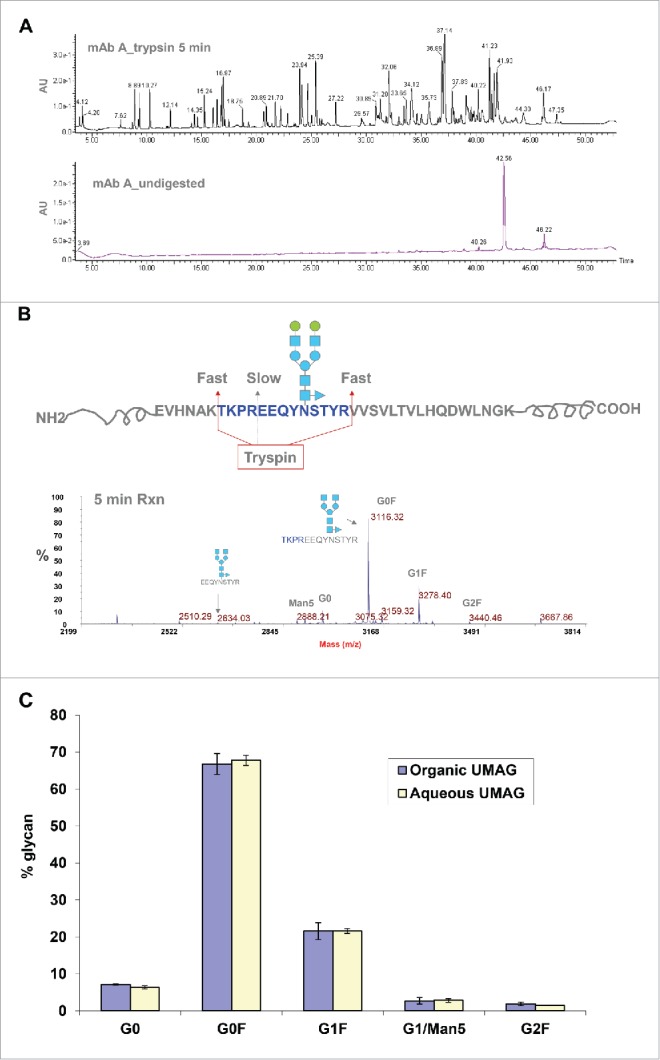
Figure 4.

Analysis of mAb A glycan profiles by UMAG in aqueous solution. (A) Analysis of mAb A digested by trypsin for 5 min (top) and undigested mAb A (bottom) by RP-HPLC. Undigested mAb A was injected at a 1/6 amount of digested antibody. (B) Different rates of cleavage by trypsin under aqueous conditions near the glycosylation site. The majority of glycopeptides were missed cleavage peptides with an internal trypsin site. (C) Comparison of glycoprofiles analyzed by organic UMAG under organic conditions (blue) (n = 2) and aqueous UMAG under aqueous conditions (yellow) (n = 4).
