Figure 5.

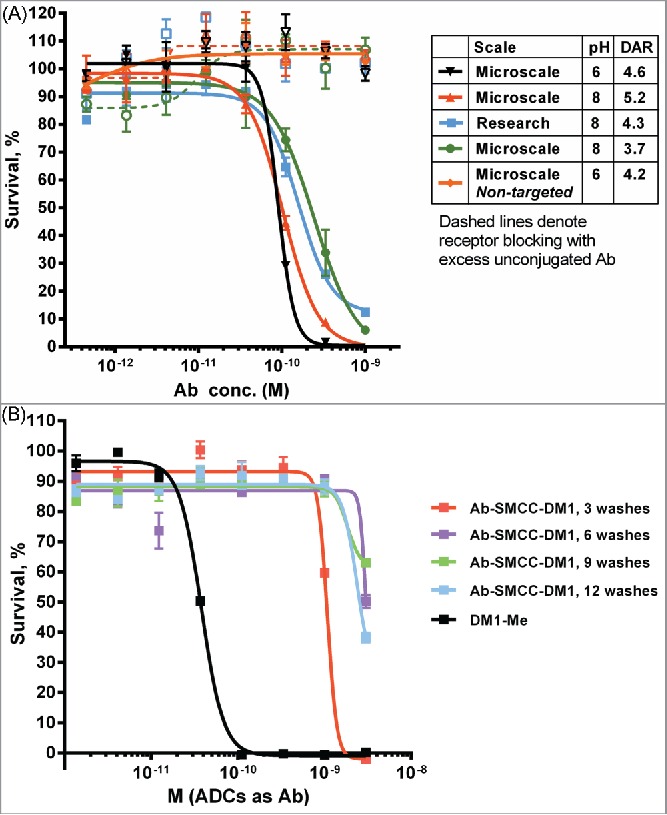
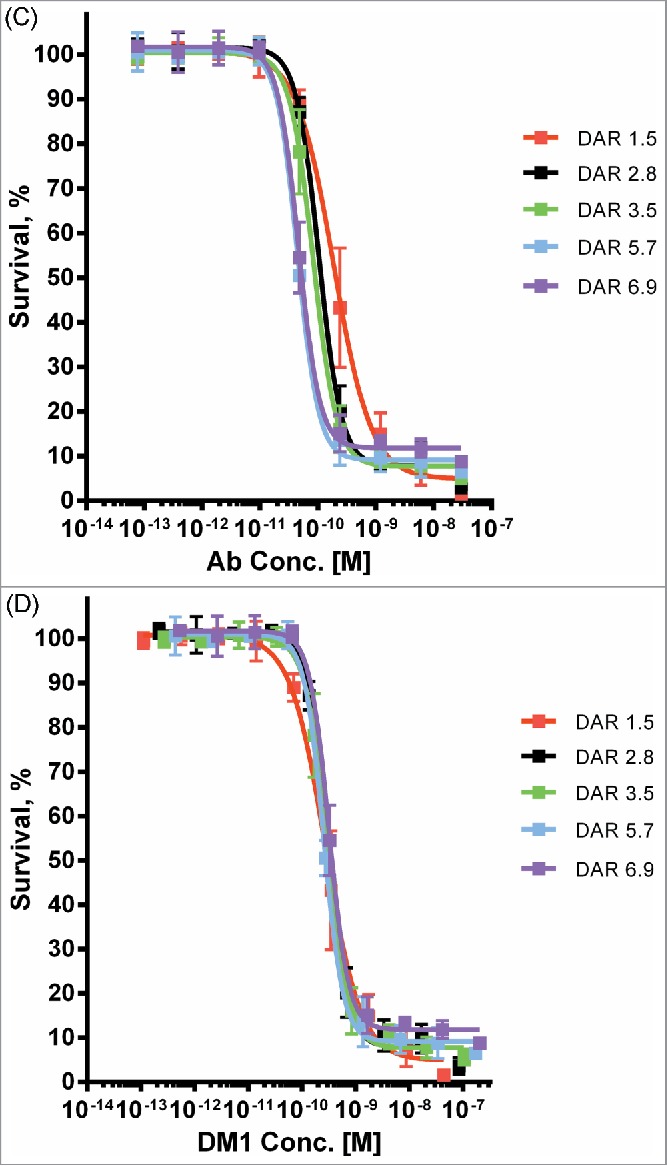
Cytotoxic potency of maytansinoid ADCs produced by microscale methods. (A) Microscale anti-CD33 conjugates produced at both pH 8 and pH 6 were compared with conjugate produced using standard methods were assayed for cytotoxic potency against MOLM-13 cells, both alone (solid curves) and in the presence of saturating unconjugated antibody (1 μM) to block specific uptake (dashed curves). (B) Cytotoxicity assay of identical mAb A2-SMCC-DM1 ADCs which were purified by the indicated number of wash steps. The cell line used (JeKo-1) does not express the antigen recognized by mAb 2, hence the cytotoxicity observed is due only to nonspecific uptake or cytotoxic impurities. Each wash consisted of the addition of fresh buffer and ultrafiltration. (C) mAb A6-SMCC-DM1 conjugates were generated with a range of DAR using microscale conjugation at pH 8. These conjugates were then assayed for cytotoxic potency on a high antigen (EGFR) density cell line (MDA-MB-483). The kill curves are plotted with antibody concentration as the X-axis. (D) The same data as in part C, but plotted with DM1 concentration as the X-axis.
Figure 5.

Continued.
