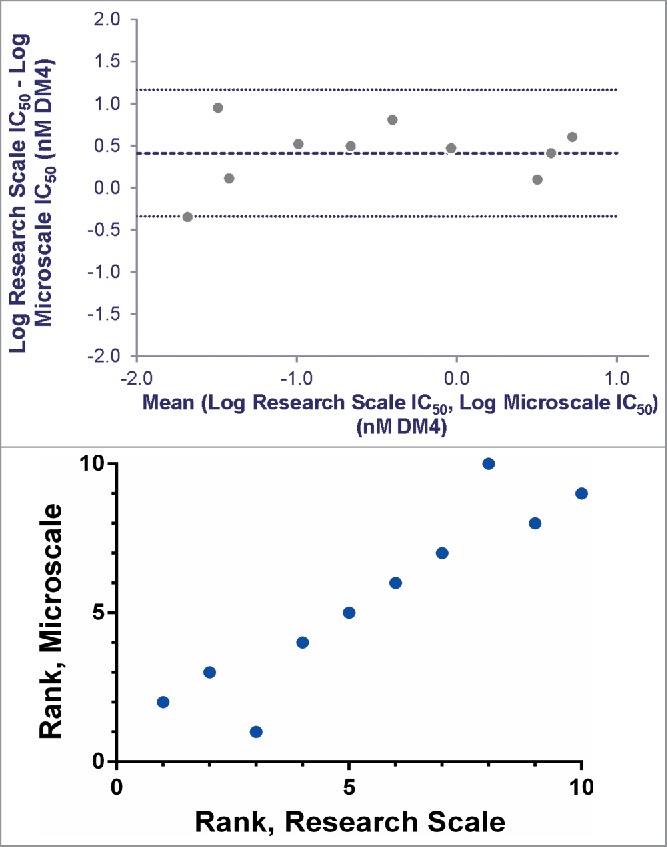
Figure 6.

Agreement between IC50 values determined for research and microscale SPDB-DM4 ADCs targeting Antigen B. For each antibody, conjugates made by both methods were simultaneously assayed for cytotoxicity on cells expressing Antigen B. (A) Agreement between research and microscale ADCs depicted in a Bland-Altman plot comparing IC50 values in log space. The mean of the differences between assays = 0.41, so the bias is 100.41, corresponding to a 2.6-fold mean difference between microscale and research scale, with microscale appearing more potent. The standard deviation of the differences between assays = 0.38, so the 95% confidence interval of a pair of microscale and research scale IC50s = 100.76 = 5.6-fold above and below the mean. (B) ADCs targeting Antigen B were ranked based on cytotoxic IC50 using research scale and microscale conjugates, and the rank order is compared.
