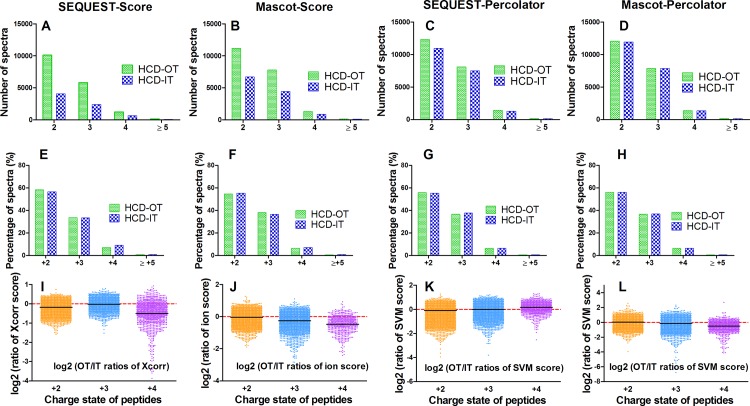
Fig 5. The comparison of OT- and IT-type detection using the back-to-back strategy (HCD-IT vs. HCD-OT).
(A-D) Number of spectra for +2, +3, +4 and ≥5 charged ions using different data interpretation methods. (E-H) Percentage of spectra for for +2, +3, +4 and ≥5 charged ions using different data interpretation methods. (I-L) Log2 (OT/IT ratio of score) distributions for +2, +3 and +4 charged peptides. Xcorr for SEQUEST, ion score for Mascot, SVM score for Percolator related combinations were presented. One replicate of the back-to-back LC-MS analyses of HCD-IT versus HCD-OT was randomly selected.

