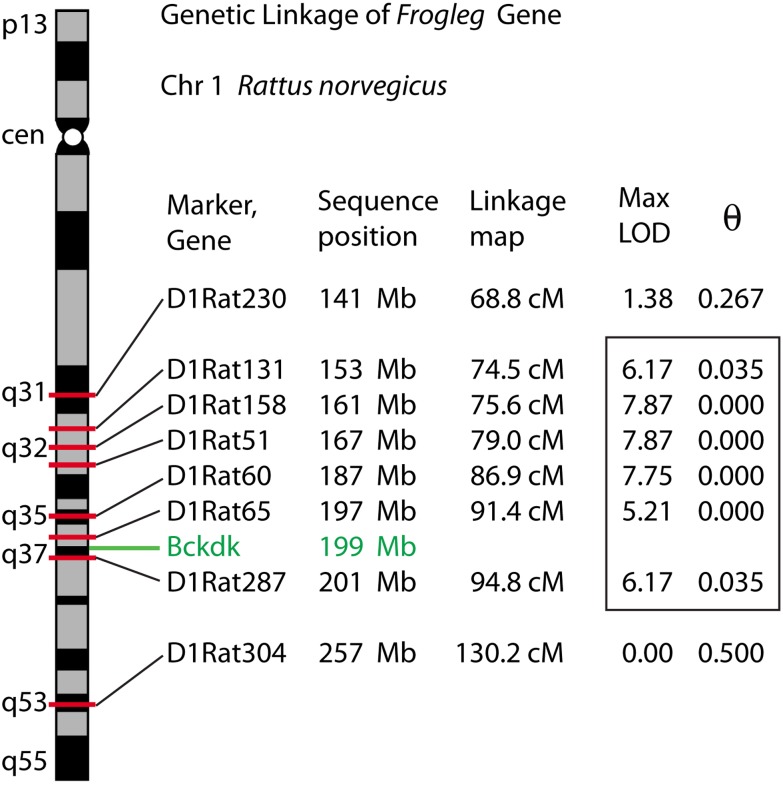
Fig 1. Linkage map of the frogleg locus on rat chromosome 1.
Ideogram of rat chromosome 1, showing polymorphic markers in the region of the Bckdk gene. Nucleotide sequence positions were determined by locating original marker amplimer sequences to the RGSC 6.0 / rn6 July 2014 assembly of the rat genome. MLINK-derived maximum LOD scores and corresponding theta values indicate linkage distance to the disease locus. The analysis was based on 11 affected and 10 unaffected individuals. Significant linkage scores identifying the initial disease interval (> 3.0) are enclosed in the box.

