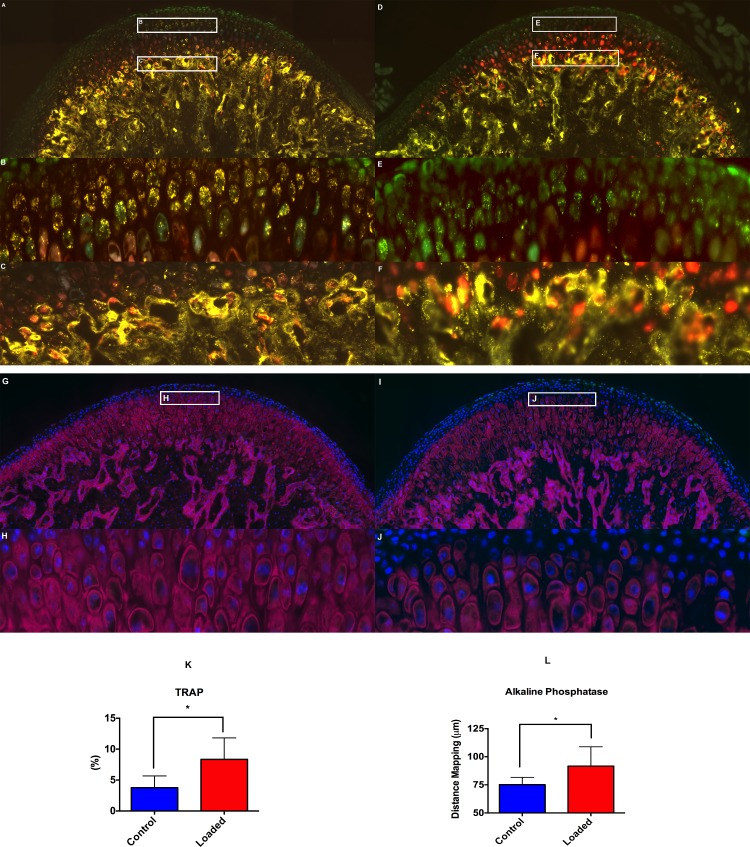
Fig 5. Altered loading increases TRAP activity and mineralization.
The histological changes (TRAP & AP) within the mandibular condylar cartilage in the altered loaded and control groups. Fig 5A–5C shows staining for TRAP in the altered loaded group, (5A) TRAP stained sagittal section of the MCC along with the subchondral bone, (5B) TRAP positive cells (punctate appearance) cells in the proliferative zone of the MCC. Number and the intensity of the TRAP positive cells in the proliferative zone of MCC are more in the loaded group, when compared to the control group, (5C) TRAP positive cells in the subchondral bone of the loaded group. Fig 5D–5F show staining for TRAP positive cells in control group, (5D) TRAP stained sagittal section of the MCC along with the subchondral bone in the control group, (5E) TRAP positive cells (punctate appearance) cells in the proliferative zone of the MCC, (5F) TRAP positive cells in the subchondral bone of the control group. (5G-5H) AP staining in the altered loaded group, (5G) AP staining in MCC and subchondral bone of loaded group, (5H) AP staining in the proliferative and fibrocartilaginous zone of the MCC. (5I-5J) AP staining in the control group, (5I) AP staining in the MCC and subchondral bone of the control group, (5J) AP staining in the proliferative zone of MCC but not in the fibrocartilaginous region of MCC. (5K) Quantification of TRAP positive pixels, (5L) Quantification of distance map. Histograms represent means ± SD. * Statistically significant difference between the altered loaded side and the control group. Scale bar = 500μm.

