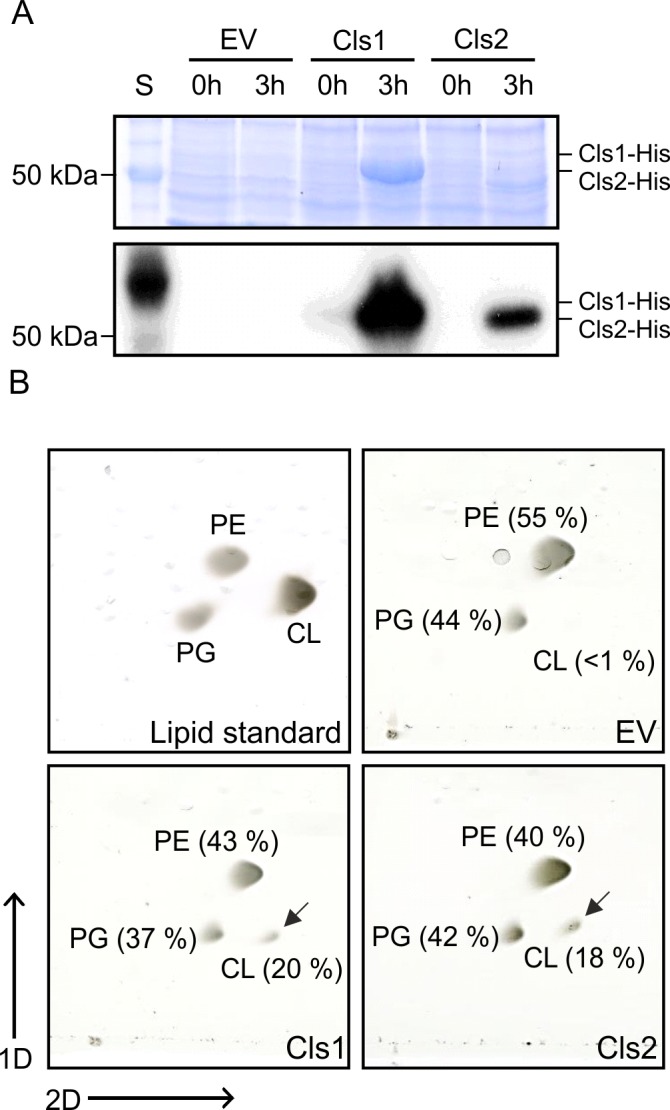
Fig 2. Phospholipid profile of E. coli strains expressing A. tumefaciens cls1 and cls2.

(A) SDS-PAGE (upper panel) and Western blot (lower panel) of cell extracts from E. coli BL21(DE3) strains producing Cls1-His and Cls2-His. E. coli strains were grown in LB medium and expression of cls1 and cls2 was induced with 0.4 mM IPTG for 3h at 30°C. A strain carrying empty vector pET24b was used as a control (EV). Total proteins were separated by SDS-PAGE, and Cls1-His and Cls2-His were detected by Western analysis using a His-tag specific antibody. (B) Phospholipid analysis of Cls1 and Cls2 producing E. coli strains. Total lipids of E. coli strains expressing either cls1 or cls2 were isolated and separated by two-dimensional thin-layer chromatography (2D-TLC). Accumulation of CL is marked by arrows and absence of CL is indicated by a dashed circle. Commercial PE, PG and CL were used as lipid standards. Lipids were visualized by CuSO4-treatement. Relative intensities of phospholipid spots were determined using Alpha Ease FC software. Abbreviations: S (BenchMark protein ladder); PE (phosphatidylethanolamine); PG (phosphatidylglycerol); CL (cardiolipin).
