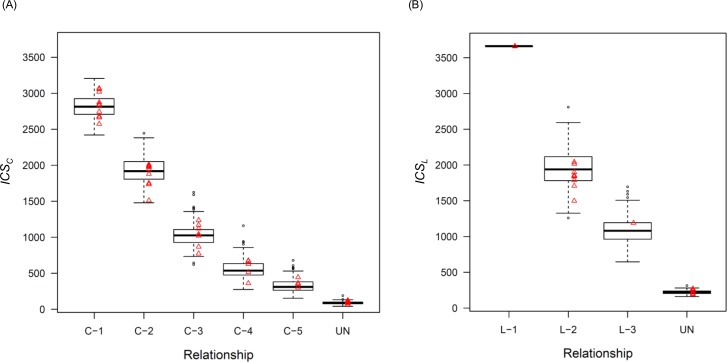
Fig 2. The expected ICS variability for each relationship.
Boxplots indicate the variability from the computationally generated genotypes. Triangular plots indicate the values from half of the actual samples. (A) ICSC variability for collateral relatives using only IBS segments longer than 4 cM and (B) ICSL variability for lineal relatives using only IBS segments longer than 3 cM.

