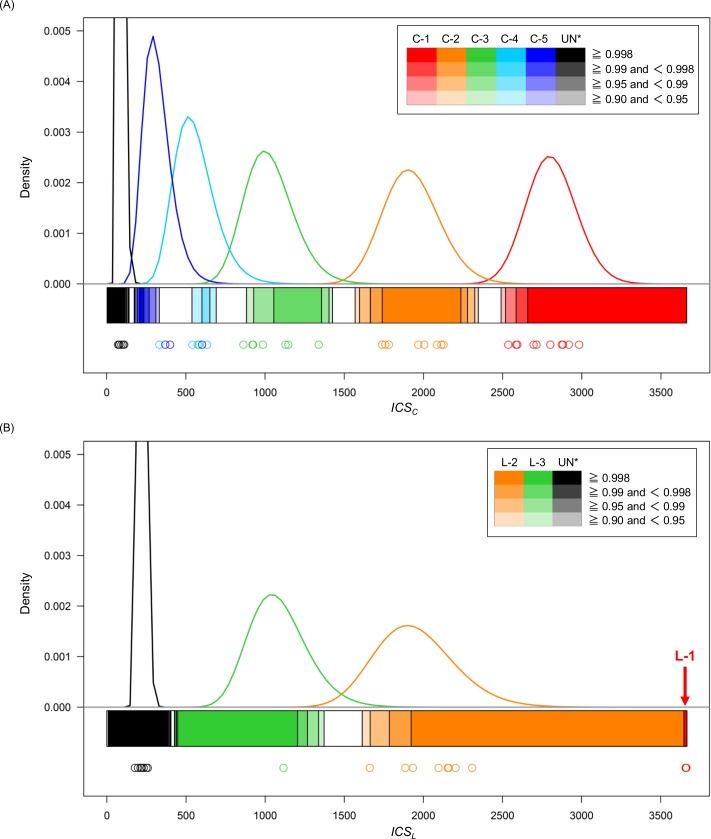
Fig 4. The range of ICS values in each Hummel’s predicate for kinship determination.
ICS values for (A) collateral relatives and (B) lineal relatives. Solid lines indicate the estimated log-normal distributions of the ICSC and ICSL values. The colors in the bar under the distributions indicate the range of the ICSC and ICSL values that can be obtained from the posterior probabilities corresponding to each Hummel’s predicate for each relationship. The plots indicate the ICSC and ICSL values calculated by the rest of the actual sample pairs. All actual L-1 pairs were almost equal to the maximum value of ICSL (i.e., 3662.522) and are indicated in red. * The distribution of UN is partially displayed because the density of the estimated distribution of UN is high.

