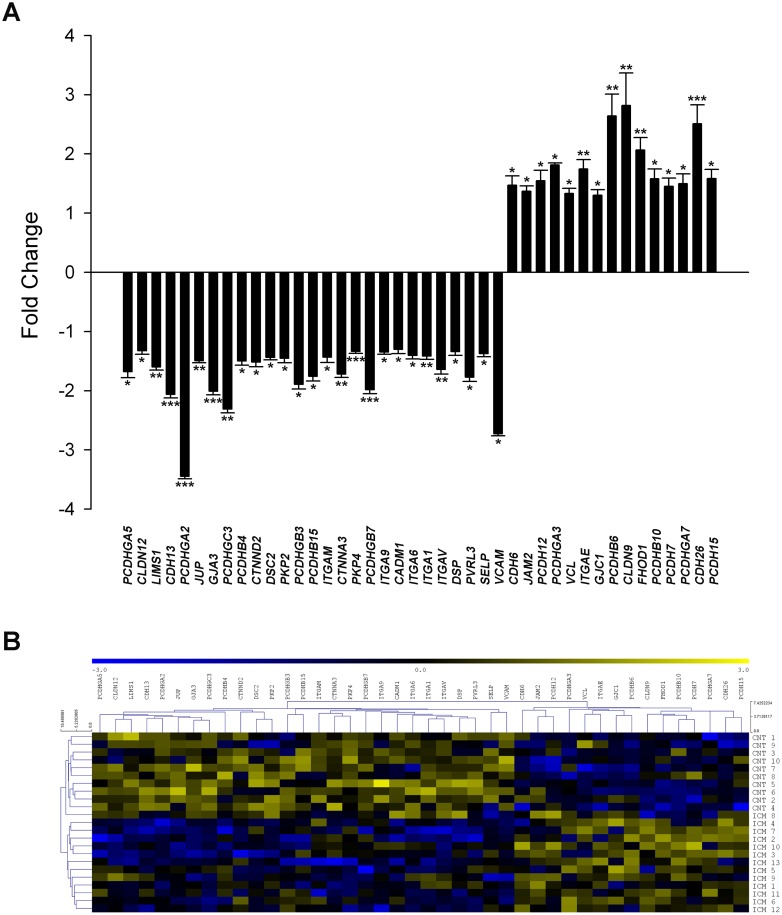
Fig 2. Differential gene expression profiles of cell adhesion molecules in ICM patients displaying 42 altered genes.
(A). RNA-sequencing results showing mRNA expression levels of cell adhesion genes. The values of the CNT group are set to 1. The data are expressed as mean ± SEM for the relative mRNA expression levels. (B). Heat map with hierarchical clustering of the transcriptomic analysis. Columns: genes; rows: samples. The relative expression level of each gene is indicated by the colour bar: blue, lowest; yellow, highest. ICM, ischemic cardiomyopathy; CNT, control. *P < 0.05, **P < 0.01, ***P < 0.001 vs CNT group.

