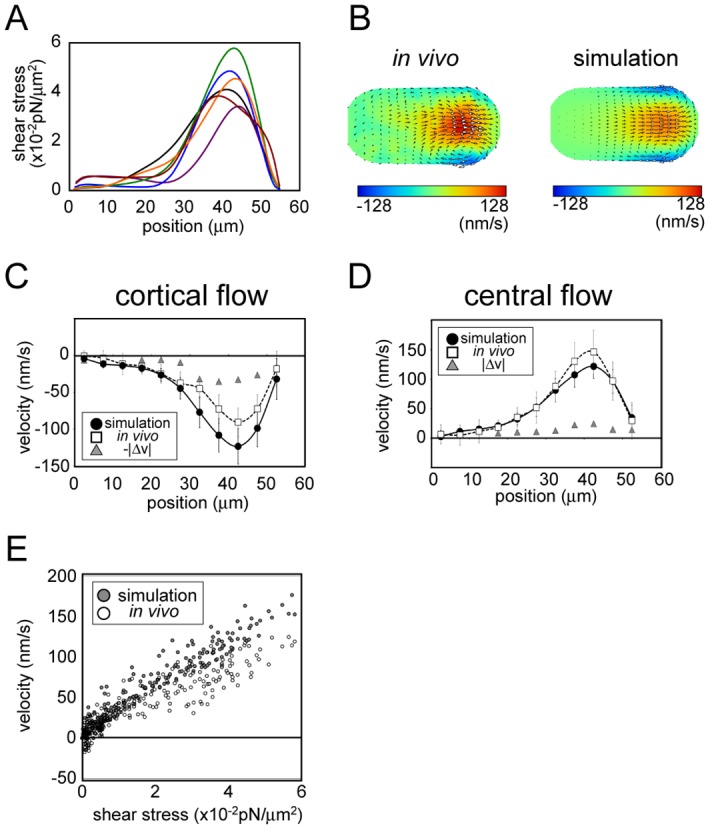
Fig 4. Estimation of shear-stress distribution in C. elegans embryos.

(A) The shear-stress distribution estimated based on the proposed method. The fitting was performed for six embryos (indicated using distinct colors). The horizontal axis shows the position along the drain (anterior)-source (posterior) axis, with 0 indicating the drain pole. (B) Color map of the flow field measured experimentally for an embryo (left) and that of the simulation performed using the shear-stress distribution estimated using data from the same embryo. The map was normalized relative to maximal velocity. (C, D) Velocity distribution along the central source-drain axis (C) and cell cortex (D) in vivo and in the simulation performed using estimated shear stress. Velocity component and position were projected onto the middle AP axis. In vivo and simulation data represent average values from six embryos and the corresponding six fitted simulations, respectively. Error bars represent one standard deviation (simulation: black; in vivo: gray). Velocities values are positive or negative when directed towards the source and drain poles, respectively. Average differences between in vivo and simulation velocities are indicated by gray triangles. (E) Velocity along the cell cortex in the simulation and in vivo at individual positions along the cell surface, plotted against estimated shear stress at the same position.
