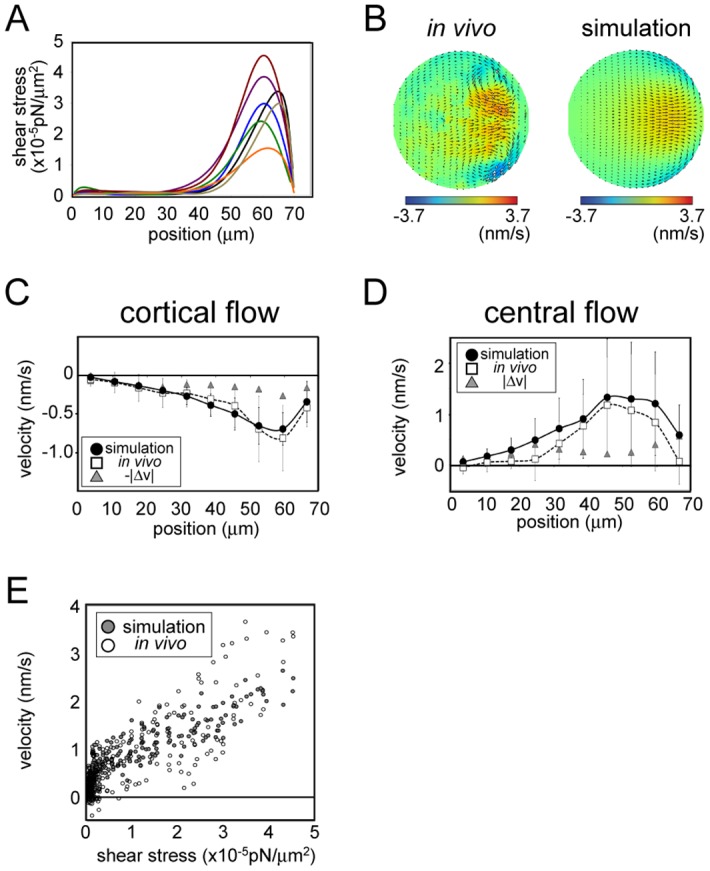
Fig 5. Estimation of shear-stress distribution in mouse oocytes.

Estimated shear-stress distribution (A), velocity distribution (B–D), and stress-velocity relationship for cytoplasmic streaming in mouse oocytes are shown as in Fig 4 for streaming in C. elegans. The fitting was performed for seven mouse oocytes. The horizontal axis in (B–D) shows the position along the drain-source (actin cap) axis, with 0 indicating the drain pole.
