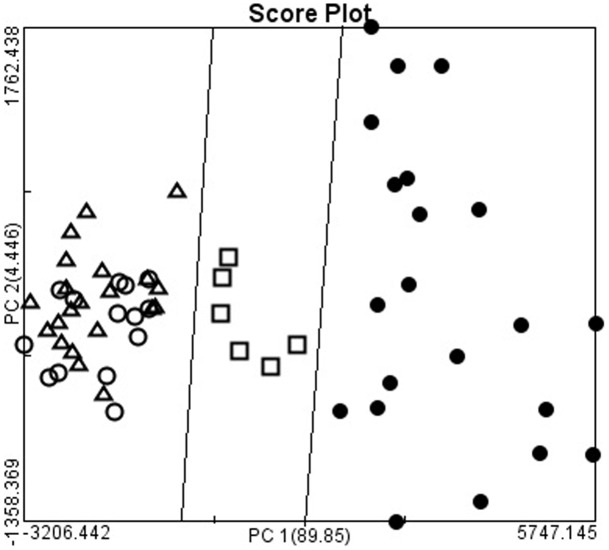
Fig 3. The two-dimensional plots of gastric adenocarcinomas.
The first two calculated principal components (PC1 and PC2), which contained most of the information, were plotted against each other for visualization. The PC1 accounting for the largest Raman spectra variance was 89.85%, and PC2 was 4.45%. The two-dimensional plots showed the separation of signet ring cell adenocarcinoma, mucinous adenocarcinoma, from and tubular carcinoma and papillary adenocarcinoma (●: signet ring cell adenocarcinoma; □: mucinous adenocarcinoma; Δ: tubular adenocarcinoma; ○: papillary adenocarcinoma).

