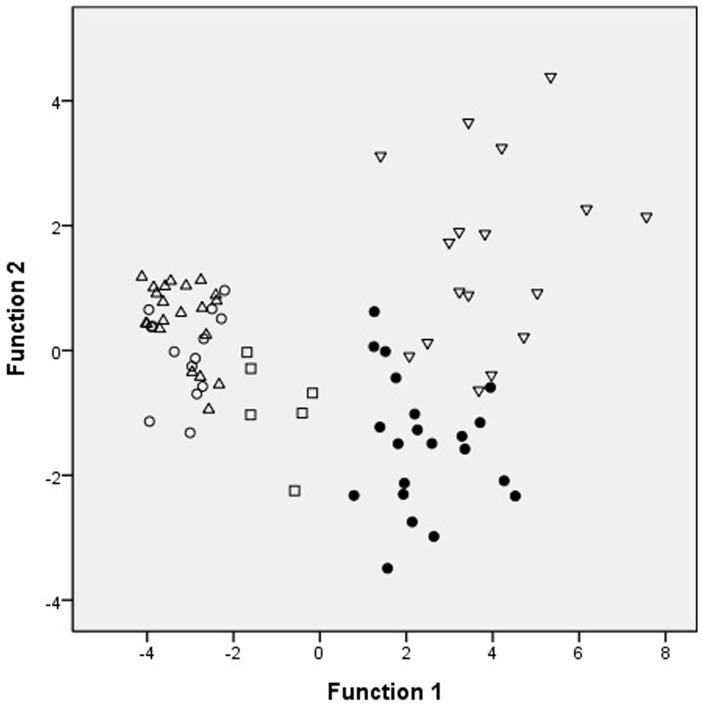
Fig 4. The two-dimensional plots of gastric adenocarcinomas and normal gastric mucosa.
Scatter plots of the first and second important discriminant function plotted against one another. The two-dimensional plots showed the separation of gastric adenocarcinoma from normal gastric mucosa (▽: normal gastric mucosa; ●: signet ring cell adenocarcinoma; □: mucinous adenocarcinoma; Δ: tubular tubular adenocarcinoma; ○: papillary adenocarcinoma).

