
Fig 6. Dimensionality reduction using the t-SNE algorithm on PheWAS codes.
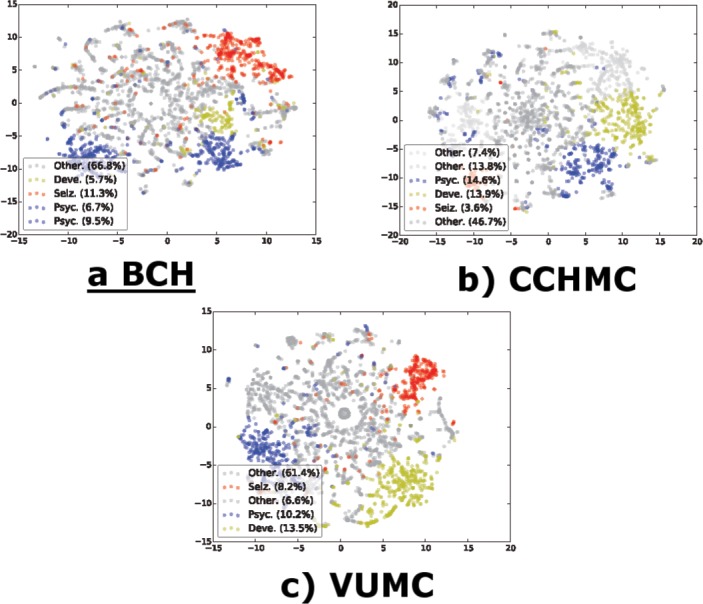
Colors label clusters from the k-means algorithm. The clusters are labeled according to the comorbidity category with the highest relative prevalence for that cluster—duplicate labels appear when there is more than one cluster dominated by the same category. (t-distributed Stochastic Neighbor Embedding—t-SNE, Phenotype Wide Association Study–PheWAS, BCH–Boston Children’s Hospital; CCHMC–Cincinnati’s Children’s Hospital and Medical Center; VUMC–Vanderbilt University Medical Center, Deve.–Developmental Disorders, Seiz.–Seizure Disorders, Psych.—Psychological Disorders).