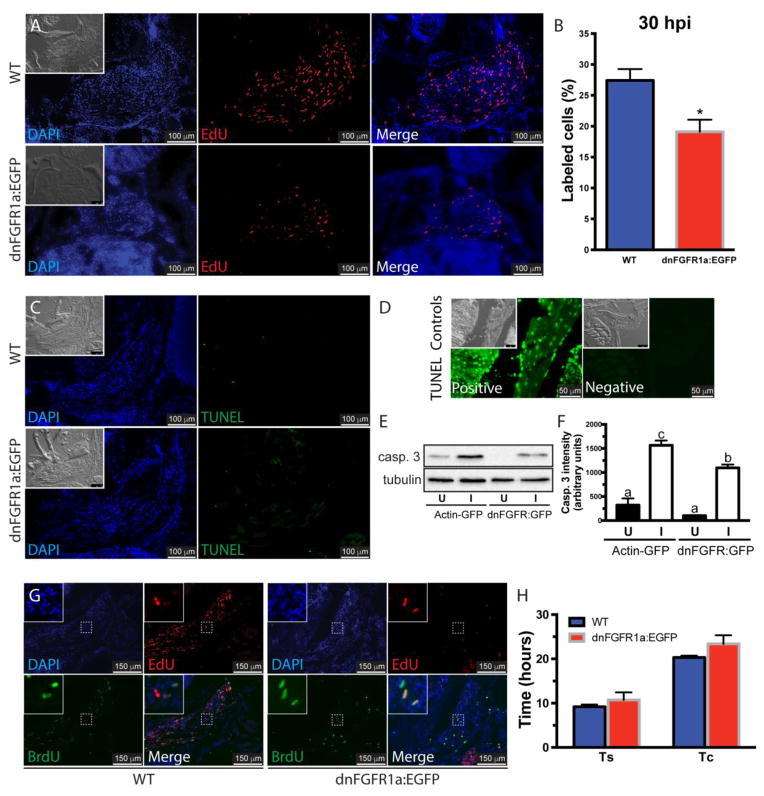
Figure 2. Inhibition of Fgf signaling reduces proliferation in the regenerating muscle.
The role of Fgf in cell proliferation was assessed using WT and hsp70-dnFGFR1a:EGFP fish at 30 hours post-injury (A). DAPI, blue; EdU, red; the insets show the differential interference contrast image. Cell proliferation in the injured muscles from hsp70-dnFGFR1a:EGFP fish was significantly lower than in WT fish (B). Values represent average ± SEM (Student’s t-test, *P < 0.05, n=3). Cell death was assessed by TUNEL assay in WT and hsp70:dnFGFR1a-EGFP fish at 48 hpi showing no apoptosis activation (pictures are representative examples of 5 fish per group), the insets show the differential interference contrast image (C). TUNEL staining DNase treated positive and negative controls, the insets show the differential interference contrast image (D). Ectopic expression of the dominant negative receptor in hsp70:dnFGFR1a-EGFP fish reduced the levels of activated caspase 3 (casp. 3) in the injured muscle compared to α actin-EGFP fish, suggesting a role of caspase 3 in myocyte dedifferentiation during muscle regeneration. Tubulin was used as a loading control (E). Densitometric quantification of the bands in 3 independent experiments (F). Different letters indicate significant differences among groups (P < 0.05, Newman-Keuls multiple comparisons test). The role of Fgf in the length of the S phase (Ts) and the cell cycle (Tc) was measured using the same fish lines (G). DAPI, blue; EdU, red; BrdU, green. In WT and hsp70-dnFGFR1a:EGFP fish, Ts and Tc were not different (H). Values represent average ± SEM (Student’s t-test; Ts, P=0.49; Tc, P=0.24; n=3). U, uninjured muscle; I, injured muscle.

