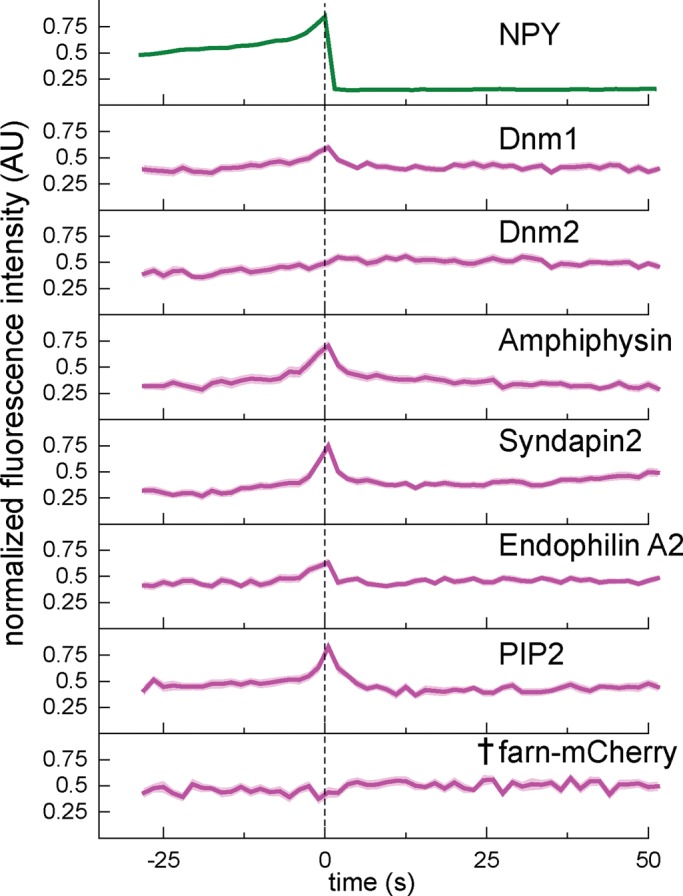
FIGURE 4:

PIP2, dynamins, and several BAR domain–containing proteins are transiently recruited to the exocytic site near the time of membrane fusion. Background-subtracted and normalized fluorescence intensity traces for each protein indicated. Top, average NPY-GFP signal for all events (N = 200) as a relative standard of time. The dashed line marks the zero time point. The mean fluorescence intensity is shown as a dark line, and the SE of the data set is shown in transparency behind the data for all traces. The dagger indicates that there is not a statistically significant shift in intensity at t = 0 relative to the beginning of the trace, determined using t tests in Supplemental Figure S6. If the SE is not visible, it is smaller than the line. N = 50 for dnm-1, 38 for dnm-2, 34 for amphiphysin, 41 for syndapin2, 45 for endophilinA2, 30 for PIP2-sensor, and 30 for farn-mCherry.
