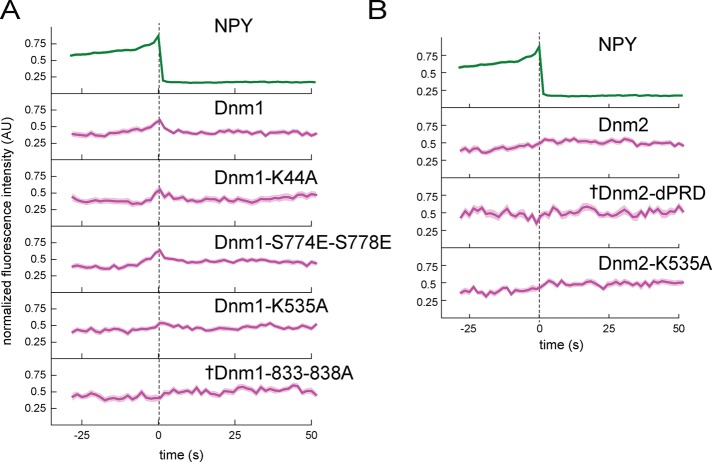
FIGURE 5:
Disruption of dynamin-1 and dynamin-2 amphiphysin binding impairs recruitment to exocytic sites. (A) Dynamin-1 point mutants were made to disrupt interaction with PIP2 (K535A), amphiphysin (833-838A), syndapin (S774E,S778E), or GTPase activity (K44A). (B) Dynamin-2 mutations were made to disrupt interaction with amphiphysin and other BAR-domain proteins (dPRD) or PIP2 (K535A). Background-subtracted and normalized fluorescence intensity traces are shown for each protein. Top, average NPY-GFP signal for all events in A (N = 135) as a relative standard of time. The dashed line marks the zero time point. The mean fluorescence intensity is shown as a dark line, and the SE of the data set is shown in transparency behind the data for all traces. If the SE is not visible, it is smaller than the line. Dagger indicates that there is not a statistically significant shift in intensity at t = 0 relative to the beginning of the trace, determined using t tests in Supplemental Figure S6. N = 50 for Dnm1, 29 for Dnm1-K44A, 43 for Dnm1-S774E-S778E, 39 for Dnm1-K535A, 46 for Dnm1-833-838A, 38 for Dnm2, 18 for Dnm2-dPRD, and 33 for Dnm2-K535A.

