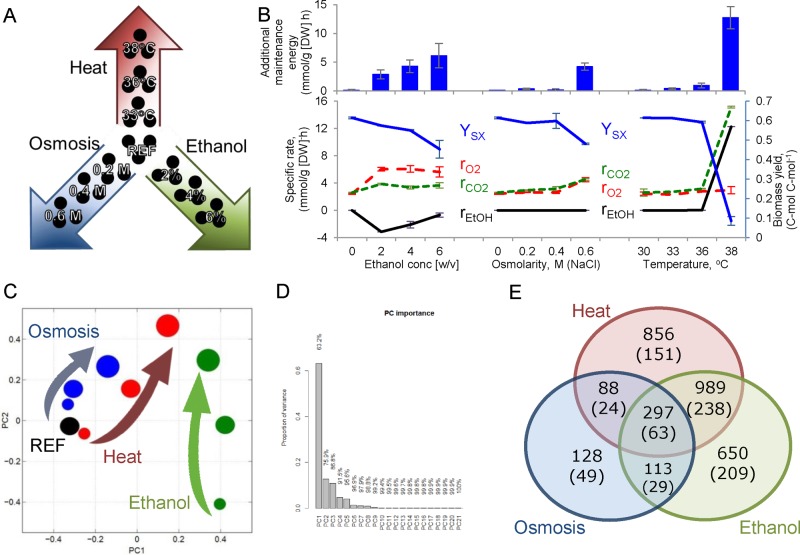
FIGURE 1:
The stress response of the yeast S. cerevisiae was studied in chemostat cultivations at a constant dilution rate (0.1 h−1) in a gradual manner. (A) Heat, osmotic conditions (NaCl), and ethanol were increased in three steps from reference conditions to the highest pretested value. (B) Physiology in terms of biomass yield (blue line, c-mol [dry biomass] c-mol−1 [consumed substrate]), specific oxygen consumption rate (red dashed line, mmol/g [DW] h), specific CO2 production rate (green dashed line, mmol/g [DW] h), and specific ethanol production rate (black line, mmol/g [DW] h). Additional maintenance energy (blue bars, mmol ATP/g [DW] h) was calculated using FBA on condition-specific genome-scale models. (C) Transcriptome data used for the PCA; increasing circle size indicates the increase in studied stress conditions, and stress is color coded accordingly: ethanol is green, osmosis is blue, and temperature is red. (D) Bar chart showing the importance of the PC components. (E) Venn diagram representing the overlap of significantly changed genes (p < 0.001); numbers in parentheses indicate greater-than-twofold change.

