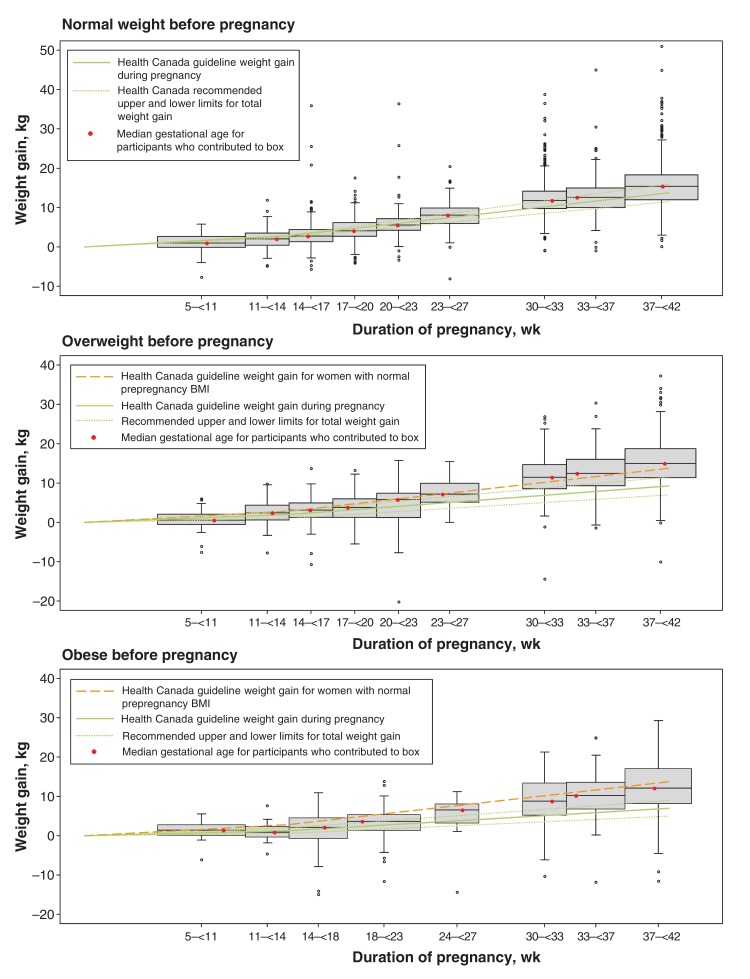
Figure 3.
Box plots of the median and interquartile range of weight gain at each measurement time point according to prepregnancy body mass index (BMI) category. Participants were included in 2 or 3 boxes each according to how many study visits they attended. The box plot for the underweight category is not shown because of the small sample size (n = 58).

