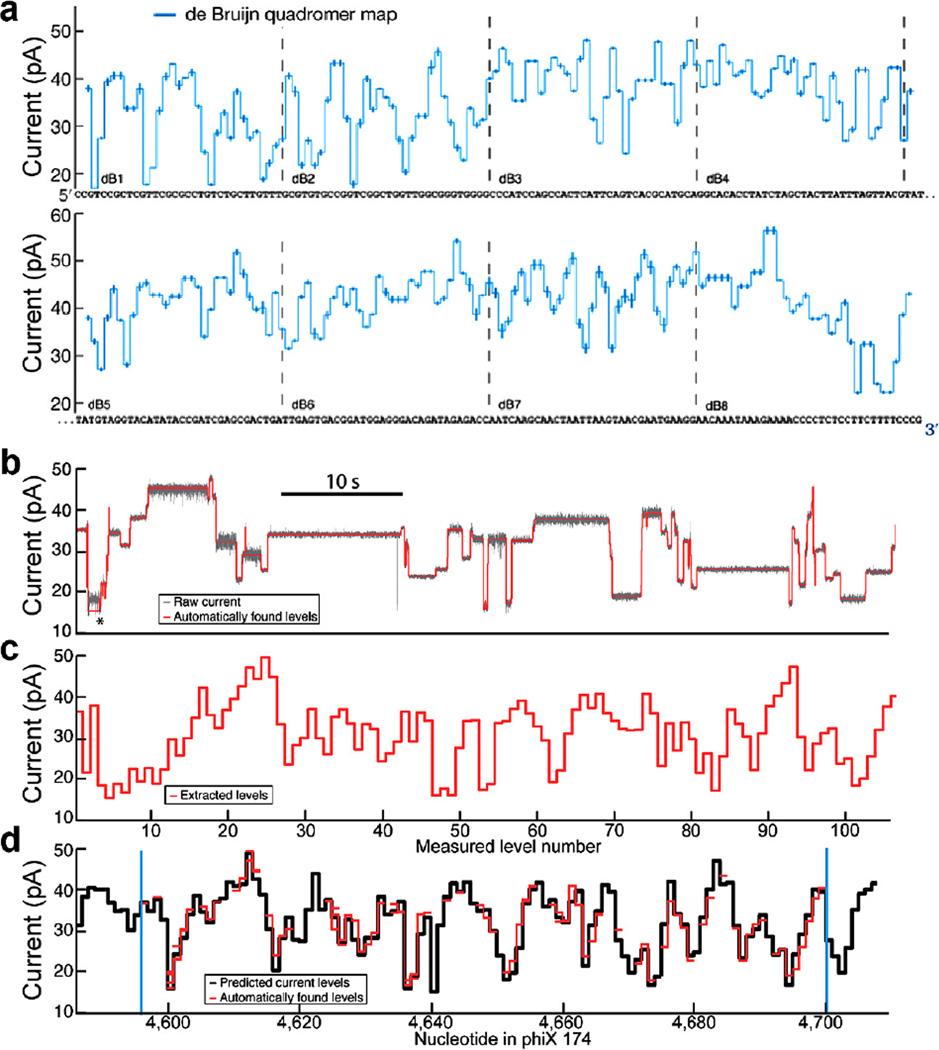
Fig. 5.
Quadromer map and alignment to sequence. (a) Graphical representation of quadromer map values aligned to the de Bruijn sequence used to measure all 256 quadromers. Each measured current value is centered on the four nucleotides that contribute significantly to its current value. CCGT corresponds to the first current level displayed, CGTC corresponds to the next current level, etc. (b) Subset of a raw current read of phi X 174 DNA. Average current levels are automatically detected and displayed in (c). (d) These current reads can be aligned to quadromer map based predictions of the reference sequence (using methods described in Appendix C). The ability to perform such alignments allows for association of enzyme behaviors with DNA sequence. Figure modified from [24].

