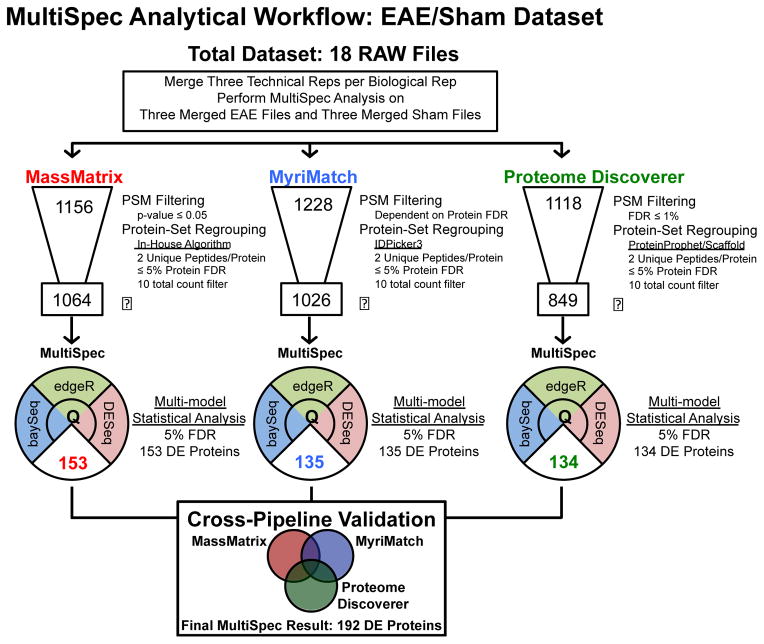
Figure 2. Schematic representation of spectral count data analysis performed on EAE/Sham lysates.
This dataset consisted of 18 raw files. Three technical replicates were collected for each of the six biological replicates. Prior to MultiSpec analysis, the technical replicates were merged into one file. The number depicted at the top of the data funnel represents the total number of homologous protein groups identified by each search engine and protein grouping approach. The specifics for each approach are highlighted to the right of each respective graphic. The boxed number at the bottom of the data funnel depicts the protein groups remaining after a ten total count filter is applied. The MultiSpec statistical approach was applied to identify differential protein expression. The median q-value/FDR was chosen as a representation of statistical significance. The number of differentially expressed proteins is highlighted in the lower pie shaped region. Protein identifications are then collapsed and differential expression is validated across search engines. A minimum q-value is chosen to rank candidates across proteomic pipelines. A final result of 192 proteins were differentially expressed by the MultiSpec analysis of the EAE/Sham dataset.

