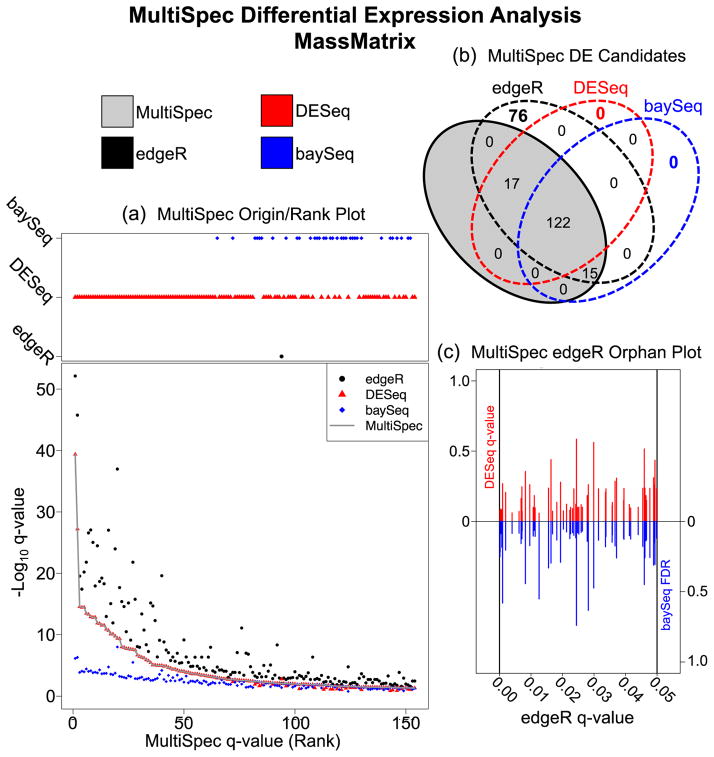
Figure 3. MultiSpec Differential Expression Analysis of spectral counts derived from the MassMatrix analysis of EAE/Sham lysates.
(a) The Origin/Rank Plot highlights the relationships between the tag-count approaches used by MultiSpec. This two part figure describes the q-value/FDR as a function of the final MultiSpec q-value/rank. The top portion indicates which statistical platform (edgeR, DESeq or baySeq) the MultiSpec q-value is derived from while the bottom portion tracks the q-values from each individual statistical approach. (b) Venn diagram of the results derived from MultiSpec. The proteins identified as statistically significant by the MultiSpec approach must have a significant q-value/FDR in at least two of the three statistical approaches. The proteins that met this criteria are highlighted in the gray shaded oval. Proteins that were identified solely by one statistical approach are considered ‘orphans’ and are not significant in the MultiSpec approach. (c) The Orphan Plot allows a quick evaluation of the statistical outputs of orphan candidates. In the edgeR Orphan plot the edgeR q-value is plotted on the x-axis while the DESeq q-values (red) and the baySeq FDR (blue) are plotted on the y-axes.

