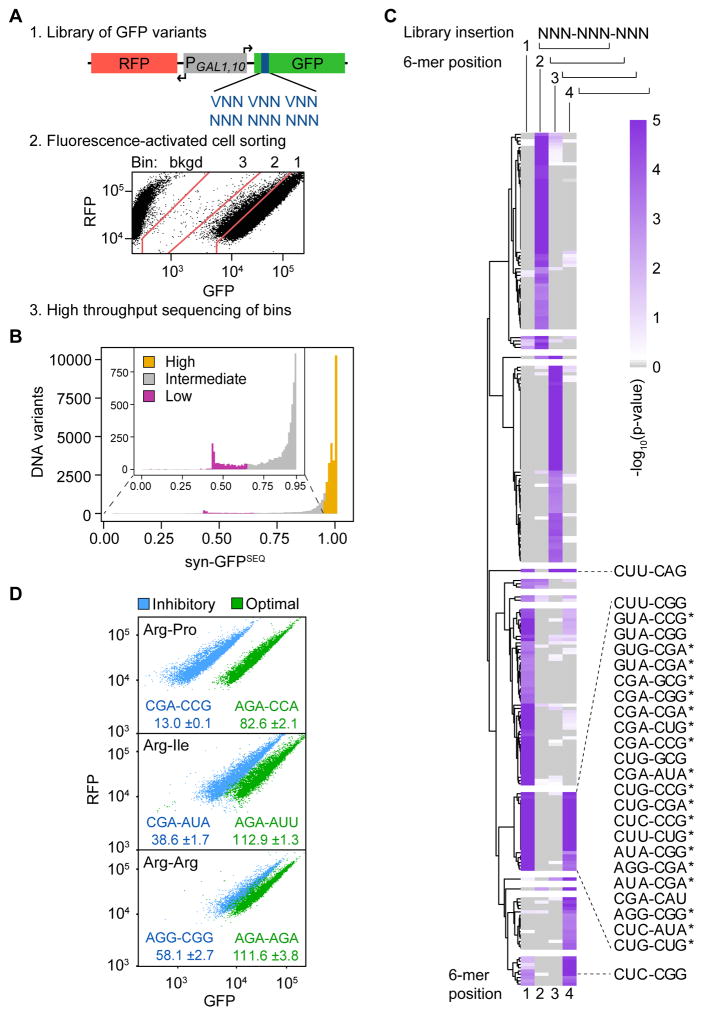
Figure 1. Identification of 6 Base Sequences Linked to Low GFP Expression.
(A) Schematic of the method to examine effects of three randomized codons on superfolder GFP expression, using the RNA-ID reporter. Shown is the FACS sort of (NNN)3 Library 1.
(B) Distribution of syn-GFPSEQ scores. Variants were assigned to low (magenta; n = 1119), intermediate (gray; n = 5127), and high (gold; n = 24417, excluding high expression synonymous references) expression categories.
(C) Significance of 6-mer enrichment in low expression variants by 6-mer position (1–4) in the 9-base variable region (library insertion). 6-mers with at least one p-value ≤ 0.001 are plotted based on hierarchical clustering of positional permutation p-values. Fifty-seven 6-mers are not plotted due to missing values; this includes 6-mers that form an in-frame stop codon. 6-mers with a p-value ≤ 0.001 at both in-frame start positions (1 and 4) are labeled (although CUG-AGG, CUG-AUA*, and CUU-AGG are not plotted because they form a stop codon at another position). Candidate inhibitory pairs that remain enriched in a reduced structure dataset are indicated with a star.
(D) Flow cytometry scatter plots from 6 individual variants; label (GFP*100/RFP).

