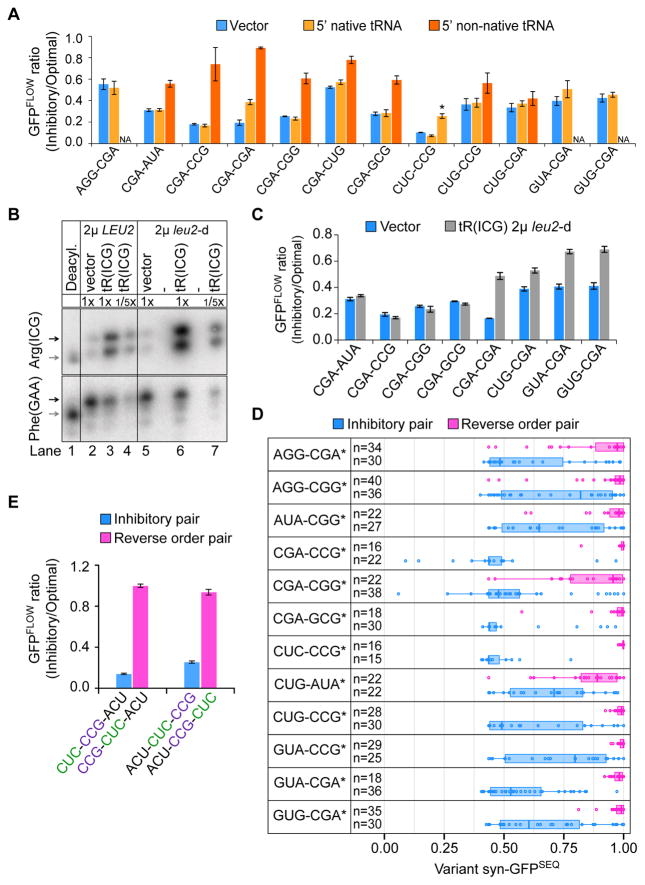
Figure 4. Inhibition Depends on Codon Order and Pair Effect.
(A) The effect on the GFPFLOW ratio of expressing a tRNA that decodes the 5′ codon of an inhibitory pair. Vector (blue), native tRNA (light orange), non-native tRNA (dark orange). Leu CUC is decoded by two native tRNAs; the exact matching tRNA is indicated by a star. Error bars represent SD. NA, not applicable. CGA-CGA data also shown in Figure 3C.
(B) Charged tRNAArg(ICG) levels increase when tRNAArg(ICG) is expressed from either a 2μ or 2μ leu2-d vector, as measured with an acidic Northern blot probed for tRNAArg(ICG) and tRNAPhe(GAA). Charged tRNA (black arrow) and uncharged tRNA (gray arrow) are indicated.
(C) Effects of increasing native tRNAArg(ICG) by expression from a 2μ leu2-d vector on the GFPFLOW ratio from each of 8 sets of variants (leu2-d vector, blue; tRNAArg(ICG), gray). Error bars represent SD.
(D) syn-GFPSEQ distribution of variants with an inhibitory pair (blue) compared to that of variants with the same pair of codons in reverse order (pink). Distributions are plotted for the 12 pairs for which only a single order of the codons is present in the list of inhibitory pairs. Boxplot edges mark the first and third quartiles. Stars indicate a corrected Wilcoxon p-value ≤ 0.006. Blue boxplots are identical to those in Figure 2A.
(E) Inhibition by the CUC-CCG pair depends upon the order of the codons. Shown is the GFPFLOW ratio for 2 sets of variants each with an inhibitory pair (blue) and the reverse pair (pink). Error bars represent SD.

