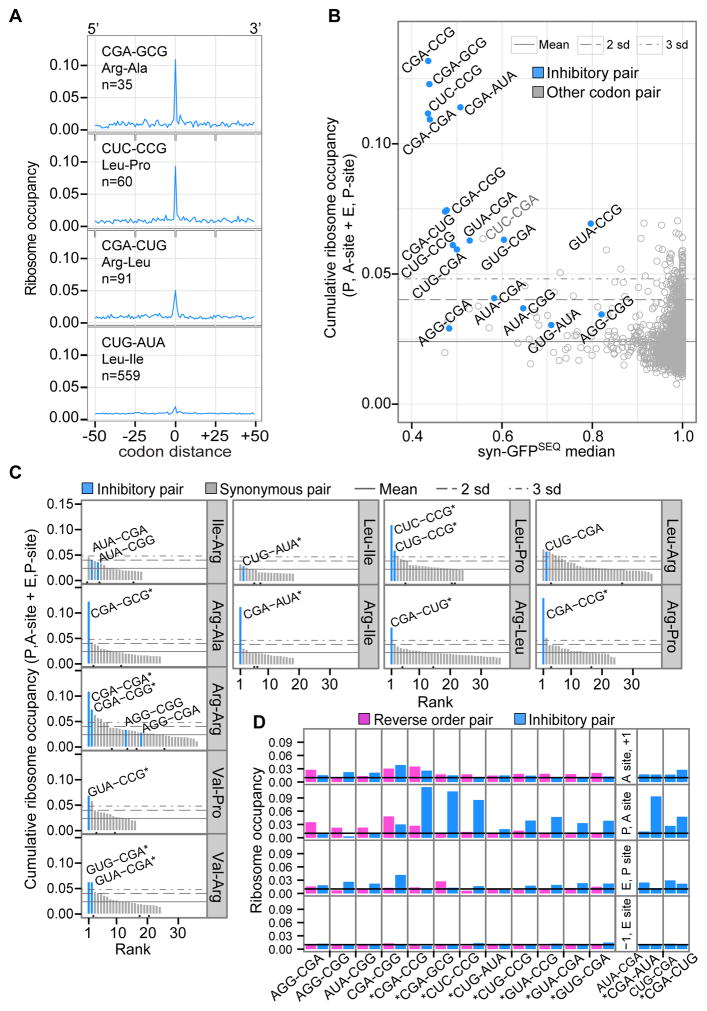
Figure 6. Inhibitory Codon Pairs in Yeast Gene Transcripts Have Elevated Ribosome Occupancies.
(A) Examples of ribosome occupancy for an inhibitory pair and surrounding baseline positions. At codon distance 0, the inhibitory pair is positioned in the P and A-sites of the ribosome. Occupancy at each position is the sum of footprints across aligned ORFs and normalized to total footprints from all window positions.
(B) Median syn-GFPSEQ of variants with a given pair versus cumulative ribosome occupancy for two positions (with the pair in the P, A-sites and E, P-sites). Horizontal lines represent the mean occupancy of all codon pairs, and 2 or 3 standard deviations above the mean (as indicated).
(C) Ranking of synonymous codon pairs by their cumulative ribosome occupancy (at P, A and E, P positions). Black dots below the bars indicate synonymous pairs used in Fisher’s exact comparisons because they have a CAI-optimal codon and a 5′ or 3′ codon identical to one of the inhibitory pairs.
(D) Ribosome occupancy by position in the ribosome for inhibitory pairs (blue) and pairs with the reverse codon order (pink). Panels on the right show two sets of pairs for which both codon orders were identified as an inhibitory codon pair. The black line indicates expected occupancy (0.01), based on an even distribution of footprints. Stars indicate inhibitory pairs with higher cumulative occupancy at the P, A-site and E, P-site positions compared to the reverse pair (one-sided Fisher’s exact corrected p-value ≤ 4.63 × 10⁻³²).
See also Table S5.

