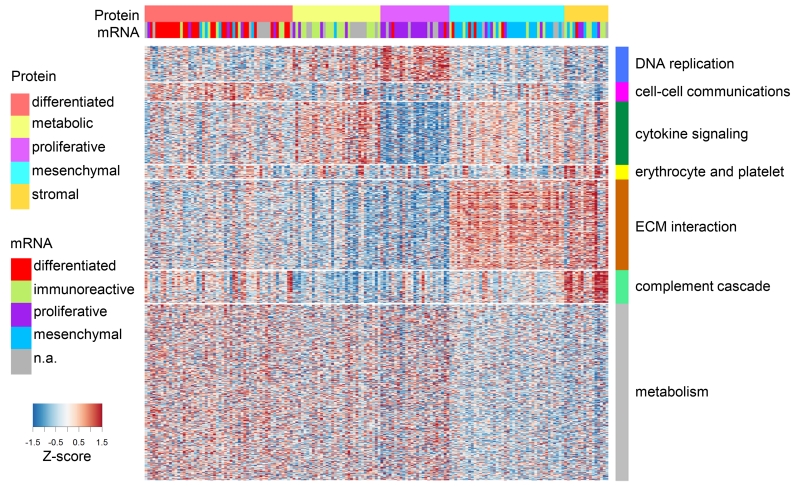
Figure 2. Proteomic subtypes and corresponding driving protein modules.
Global proteomics abundance is shown in a heatmap with TCGA samples represented by columns ordered by protein subtype where rows represent proteins. Color of each cell indicates z-score (log2 of relative abundance scaled by proteins’ standard deviation) of the protein in that sample; red is increased and blue is decreased (relative to the pooled reference). Transcriptome-based subtypes (Verhaak et al., 2013) and the proposed proteomic subtypes are indicated in color above the heatmap. WGCNA-derived modules are delineated with the row color panel and annotated according to the pathways based on enrichment of KEGG and Reactome ontologies.

