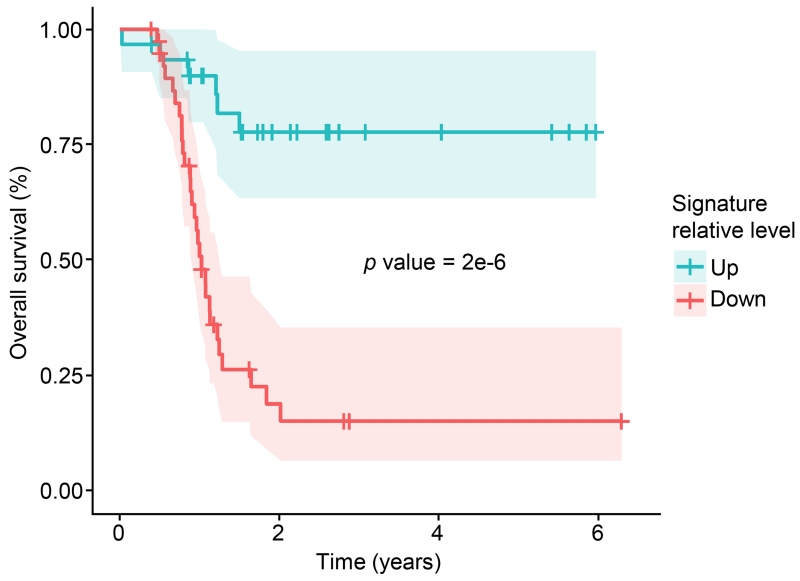
Figure 4. Kaplan-Meier plot of overall survival stratified by CNA-derived signatures.
A survival plot is shown for a consensus of the four best signatures (see Figure S4A and Table S6) identified from analysis of proteins affected in trans by CNAs. Models were trained using a lasso-based Cox proportional hazards model on the samples from PNNL, and shown are the survival curves from these models applied to the non-overlapping data from the JHU analysis, with the up (red; above the median) and down (blue, below the median) signatures each representing 45 patients. A vote was taken among the four most predictive signatures, and the results of this vote are shown. Probability of death is shown on the y-axis vs. survival time in years on the x-axis. Shaded ribbons denote 95% confidence intervals.

