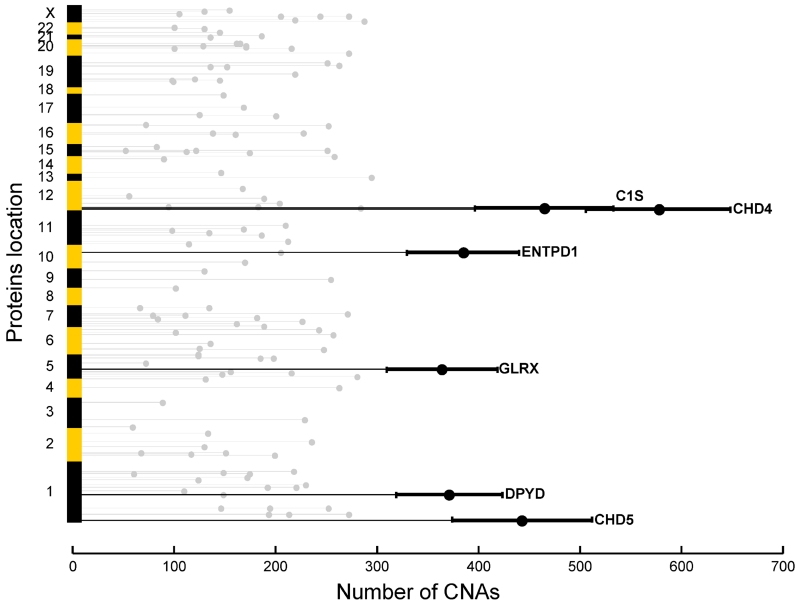
Figure 5. Number of CNAs statistically explained by proteins significantly associated with CIN index.
A total of 128 proteins selected for their association with CIN were arranged along the chromosomal locations of their corresponding genes (y-axis). The length of the light grey horizontal lines indicates the number of CNAs significantly correlated with the protein across all chromosomes except for the protein’s corresponding gene coding region (x-axis). The top-ranked proteins are annotated and highlighted with dark lines to show the bootstrap-estimated 95% confidence intervals.

