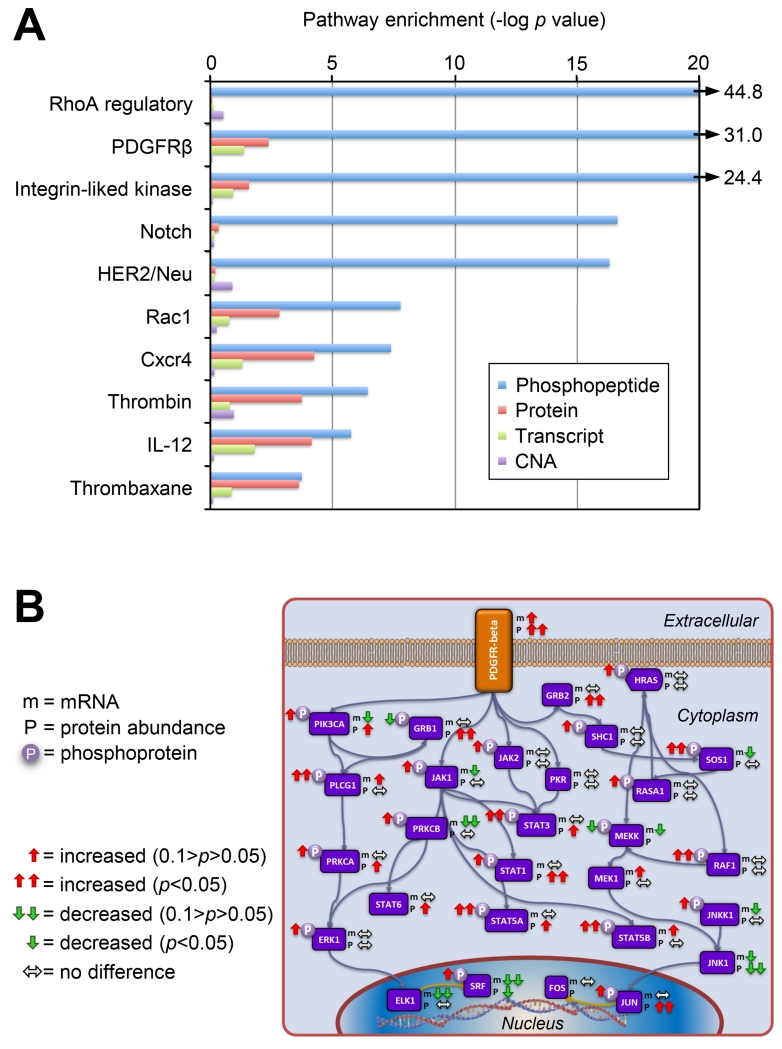
Figure 7. Pathway analysis associated with patient survival.
A) Pathway components were statistically analyzed using a two-sided t test between samples from patients surviving <3 years (short survival) and patients surviving >5 years (long survival) for differences in CNA, mRNA expression, protein or phosphorylation abundance. All significant pathways for mRNA and protein are shown (Benjamini-Hochberg adjusted p value <0.05) and the most significant pathways for phosphoproteomics are plotted on the x axis as the −log of the p value. Results show that phosphorylation provides additional information about the functional state of tumors. B) Simplified PDGFR-beta pathway showing differences between short and long survivor groups for protein abundance (p), transcript abundance (m), and phosphopeptide abundance (circled P).

