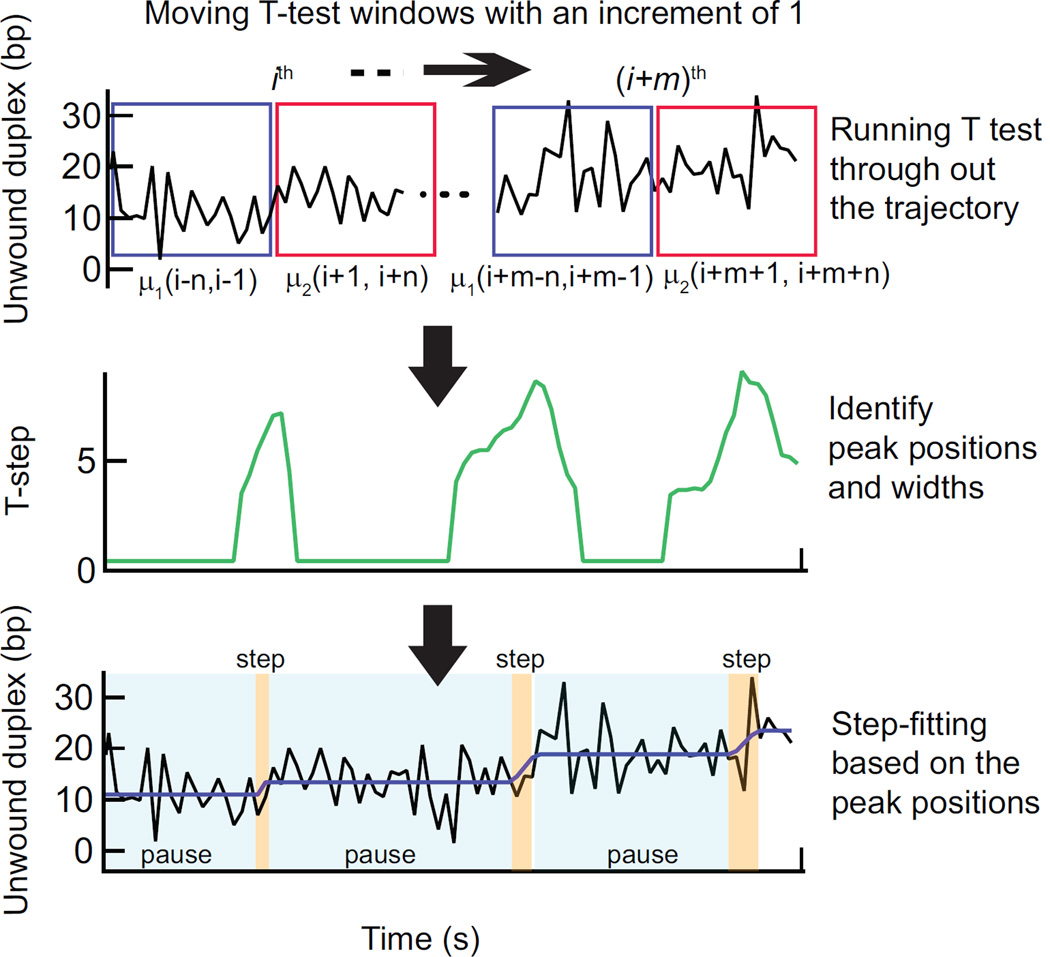
Figure 3.
T-test step detection method. At each point i in the time trajectory a Student’s T-test is performed on two windows of n points prior and subsequent to the ith point (indicated as blue and magenta boxes) (Top). T-test analysis results in a T-step profile (high-pass filtered absolute value of the t-statistic). The peaks correspond to the center of the transitions in the time trajectory and the widths of the peaks are proportional to the duration of the transitions. The peak positions and respective widths are identified (middle). These points are filtered to remove spurious transitions and then used to produce a trial fit of the data (bottom, black line) to a series of dwells (pauses) and runs (steps) of finite duration. Based on this initial fit, the entire data set is then fit with an all-at-once function of the same form. This fit (purple line) provides the durations and amplitudes of pauses and steps (Bottom).

