
Figure 2.
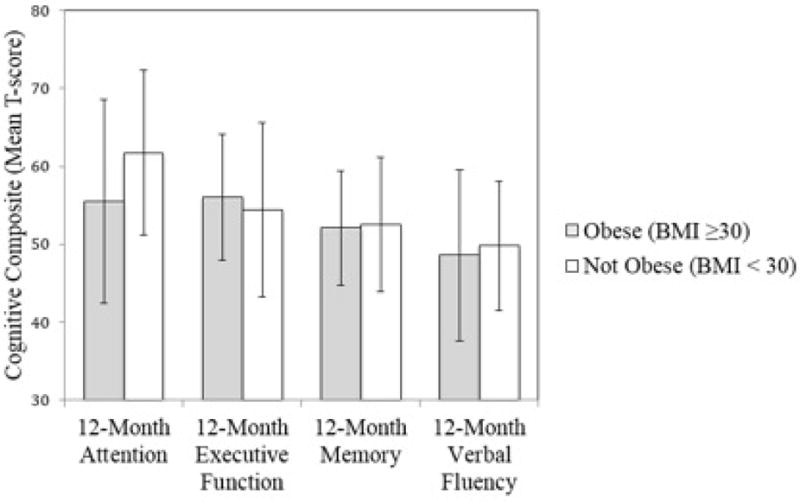
Y-axis represents T-score values. Bars plot the mean composite T-score for each cognitive domain 12 months after surgery; error bars represent standard deviations. There was a significant between BMI group difference for 12-month attention after adjustment for baseline hypertension, type 2 diabetes mellitus, sleep apnea, and baseline attention as well as duration of time since age 18; as shown, participants who were obese at the age of 18 exhibited lower attention performance post-surgery relative to their non-obese counterparts. No significant differences emerged for the other cognitive domains. BMI = body mass index.