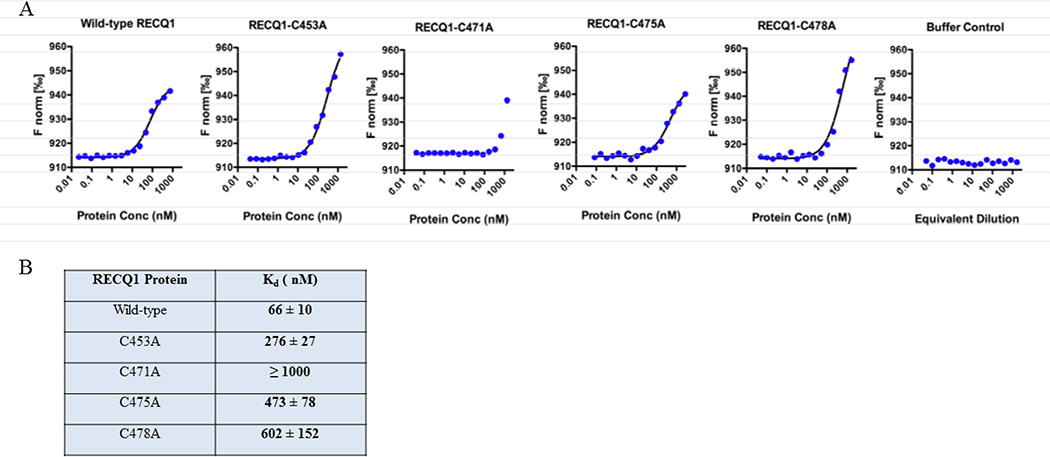
Figure 8. Measurement of dissociation constant using microscale thermophoresis (MST).
Fluorescently-labeled forked duplex DNA (20 nM) was mixed with 2-fold serial dilutions of protein and analyzed by MST. The proteins were diluted in MST binding buffer to give final concentrations of 0.02–750 nM for wild-type RECQ1, 0.04–1370 nM for C453A, 0.04–1350 nM for C471A, 0.08–2730 nM for C475A, and 0.05–1650 nM for C478A. As a control, protein storage buffer was serially diluted with MST binding buffer and analyzed. The MST signal was plotted versus the log of the protein concentration, and the data were fit to a non-cooperative binding model to estimate Kd.

