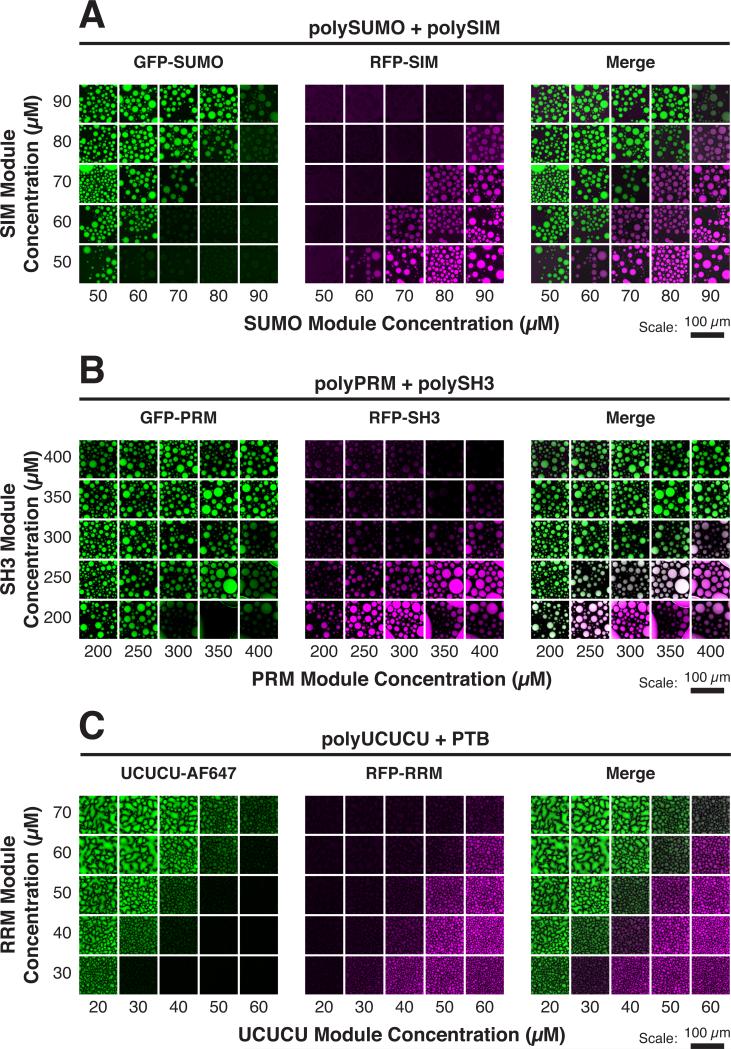
Figure 1. Phase Diagram Position Dictates Client Recruitment.
Solutions of multivalent scaffolds plus the indicated clients were imaged for client fluorescence. AF, Alexa fluorophore.
(A) GFP-SUMO (green) and RFP-SIM (magenta) (100 nM each) were mixed with the indicated module concentrations of polySUMO and polySIM. (B) GFP-PRM (green) and RFP-SH3 (magenta) (200 nM each) were mixed with the indicated module concentrations of polyPRM and polySH3. (C) UCUCU-AF647 (green) and RFP-RRM (magenta) (200 nM each) were mixed with the indicated module concentrations of polyUCUCU and PTB.
See also Figure S1.

